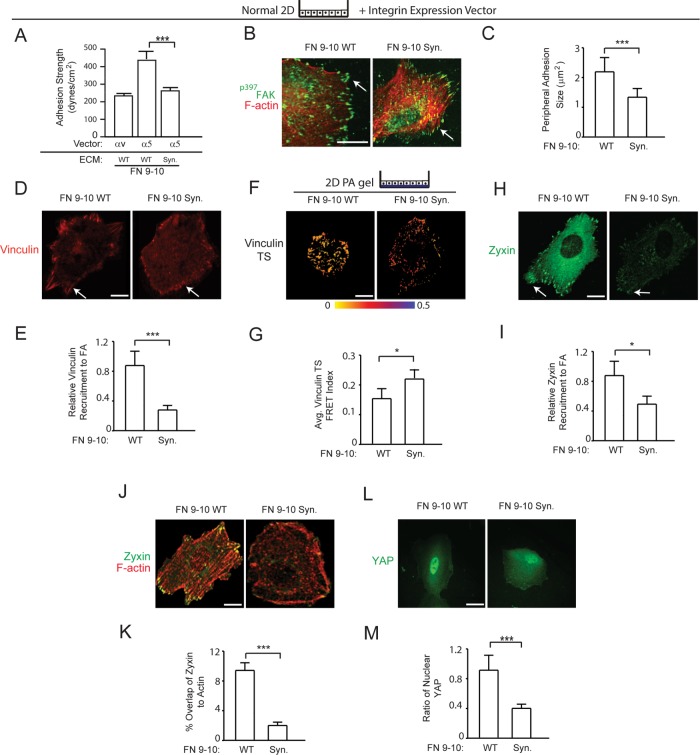
FIGURE 6:
The α5β1-integrin adhesive bond enhances mechanotransduction in MECs. (A) Bar graphs showing adhesion strength of nonmalignant MECs expressing αv or α5 plated on recombinant FN 9–10 (FN 9–10 WT) and α5 plated on recombinant FN 9–10 with the synergy-site mutated (FN 9–10 Syn). (B) Immunofluorescence confocal images of MECs expressing α5 integrin plated on FN 9–10 WT or FN 9–10 Syn stained for p397FAK (green) and actin with phalloidin (F-actin; red). Scale bar: 10 μm. (C) Bar graph quantifying size of peripheral adhesions shown in B. (D) Immunofluorescence confocal images of MECs expressing α5 integrin plated on FN 9–10 WT or FN 9–10 Syn stained for vinculin. Scale bar: 3 μm. (E) Bar graphs showing quantification of relative amount of vinculin recruited to focal adhesions in MECs shown in D. (F) FRET images of MECs expressing α5 integrin and the vinculin force sensor plated on polyacrylamide gels conjugated with FN 9–10 WT or FN 9–10 Syn. Scale bar: 5 μm. (G) Bar graphs showing quantification of FRET index at focal adhesions in MECs shown in F. (H) Immunofluorescence confocal images of MECs expressing α5 integrin plated on FN 9–10 WT or FN 9–10 Syn stained for zyxin. Scale bar: 3 μm. (I) Bar graphs showing quantification of zyxin recruited to focal adhesions in MECs shown in H. (J) Immunofluorescence confocal images of MECs expressing α5 integrin plated on FN 9–10 WT or FN 9–10 Syn double-stained for zyxin and F-actin (Phalloidin). Scale bar: 3 μm. (K) Bar graphs showing quantification of zyxin colocalization to actin in MECs shown in J. (L) Immunofluorescence images of MECs expressing α5 integrin plated on FN 9–10 WT or FN 9–10 Syn stained for YAP. Scale bar: 15 μm. (M) Bar graphs quantifying percent nuclear YAP in MECs shown in I. For the immunofluorescence and FRET experiments, results are represented with the mean ± SEM of three separate experiments with either 10–15 cells (immunofluorescence analysis) or 25 cells (FRET analysis) analyzed per each condition for each experiment *, p < 0.05; ***, p < 0.001.

