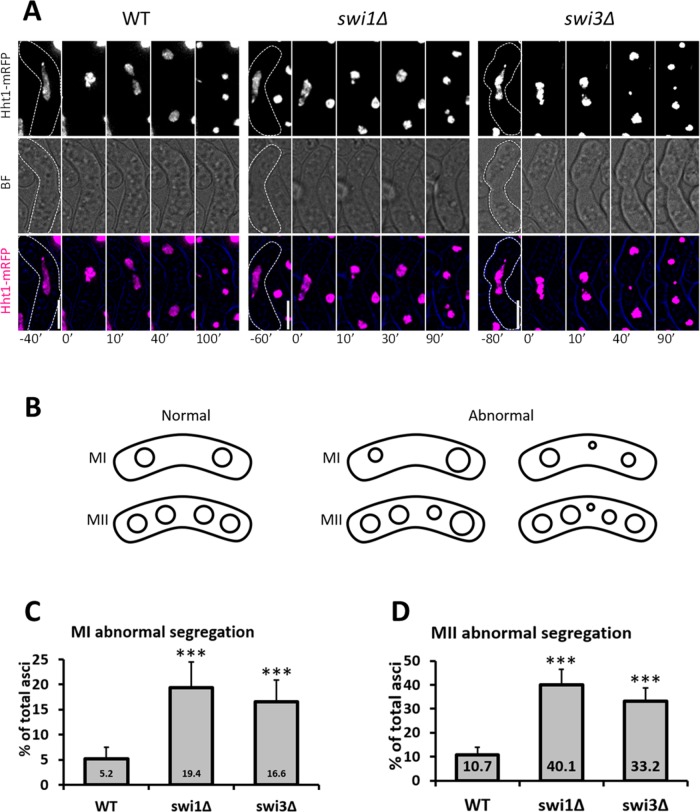
FIGURE 3:
Meiotic segregation in FPC mutants. (A) Live-cell images of meiotic cells carrying fluorescently tagged histone3 (Hht1-mRFP). Panels are shown for a fluorescent channel and bright field. A false-color image is rendered to show merged signals. Dotted cell outlines are overlaid on panels for easier visualization of meiotic cells. Images that show the characteristics of each reported mutant phenotype were used. Displayed time frames were chosen for optimal representation of nuclear dynamics. The meiotic phases shown are HT, metaphase (MT), MI, and MII. Minute 0 (0′) denotes the last nuclear mass contraction in metaphase I before homologous chromosomes separate in anaphase I (10′). Upright scale bars: 5 µm. (B) Cartoon depicting the products of normal and abnormal divisions in MI and MII. (C, D) Quantification of abnormally segregated asci from microscopy images shown in A. More than 150 cells were scored from at least two independent movies for each genotype. Chi-squared analysis was used to determine significance. p values are reported as follows: ***, p < 0.001. Error bars represent 95% confidence intervals.

