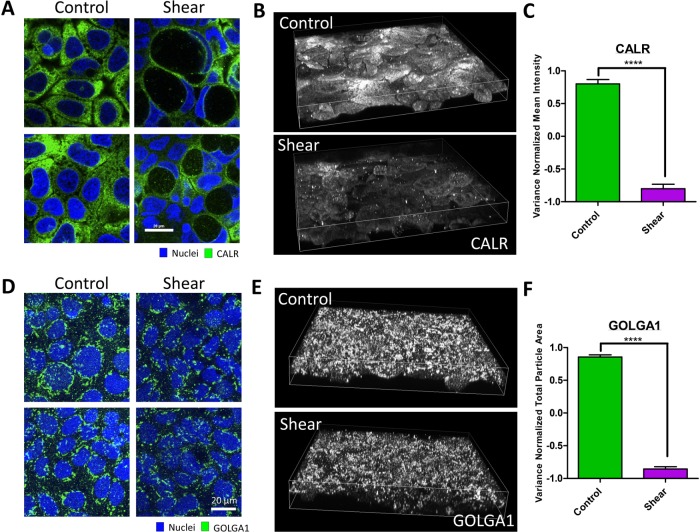
FIGURE 3:
Shear-induced vacuolar membranes originate from the endoplasmic reticulum. (A) Representative IF images the ER marker, calreticulin (CALR) distributed in the cytoplasm or around vacuoles of cell monolayers induced by shear overnight compared with static control. (B) Three-dimensional reconstruction of cell volumes depicting CALR. (C) Quantification of the mean intensity of CALR in cell volumes exposed to overnight shear compared with control. (D) Representative IF images of the Golgi marker, Golgin-97 (GOLGA1), in cell monolayers induced by shear overnight compared with static control. (E) Three-dimensional reconstruction of cell volumes depicting GOLGA1 exposed to overnight shear compared with control. (F) Quantification of GOLGA1+ particles by total particle area. Error bars represent SEM from n = 3 independent experiments. Data scales are normalized values derived from mean centering and variance scaling of each set of experiments. ****P < 0.0001 by t test.

