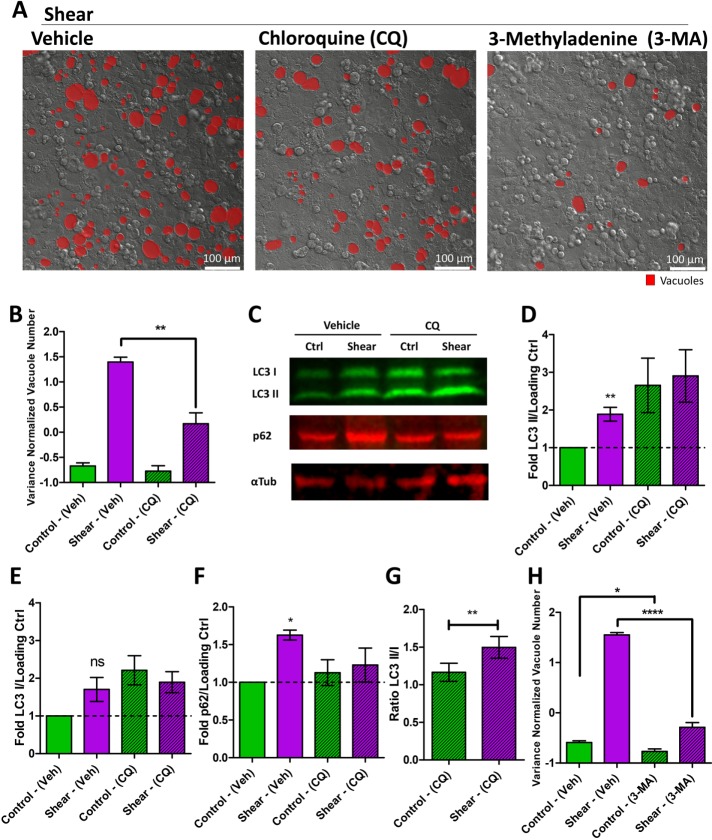
FIGURE 4:
Shear stress induces the autophagy machinery to form vacuoles. (A) Representative DIC images of vacuole formation induced in cell monolayers by shear overnight in vehicle, chloroquine (CQ), or 3-methyladenine (3-MA)-treated cell monolayers. Vacuoles are marked in red. (B) Quantification of the number of vacuoles formed resulting from shear overnight or static control, comparing monolayers treated with vehicle or CQ. Data scales are normalized values derived from mean centering and variance scaling of each set of experiments. **P < 0.01 by t test. (C) Representative quantitative immunoblot of LC3B, p62, and α-tubulin (loading control) under conditions of shear stress overnight compared with static control on cell monolayers, with vehicle or CQ. Quantification of the (D) LC3B II, (E) LC3B I, and (F) p62 bands normalized to a loading control expressed as a fold difference to static condition with vehicle. *P < 0.05, **P < 0.01 by one sample t test compared with 1 (unchanged: dotted line). (G) LC3B II/LC3B I ratio comparing control and shear conditions under CQ. **P < 0.01 by t test. (H) Quantification of the number of vacuoles formed resulting from shear induction overnight or static control, comparing monolayers treated with vehicle and 3-MA. Data scales are normalized values derived from mean centering and variance scaling of each set of experiments. *P < 0.05, ****P < 0.0001 by t test. All error bars represent SEM from n = 3 independent experiments.

