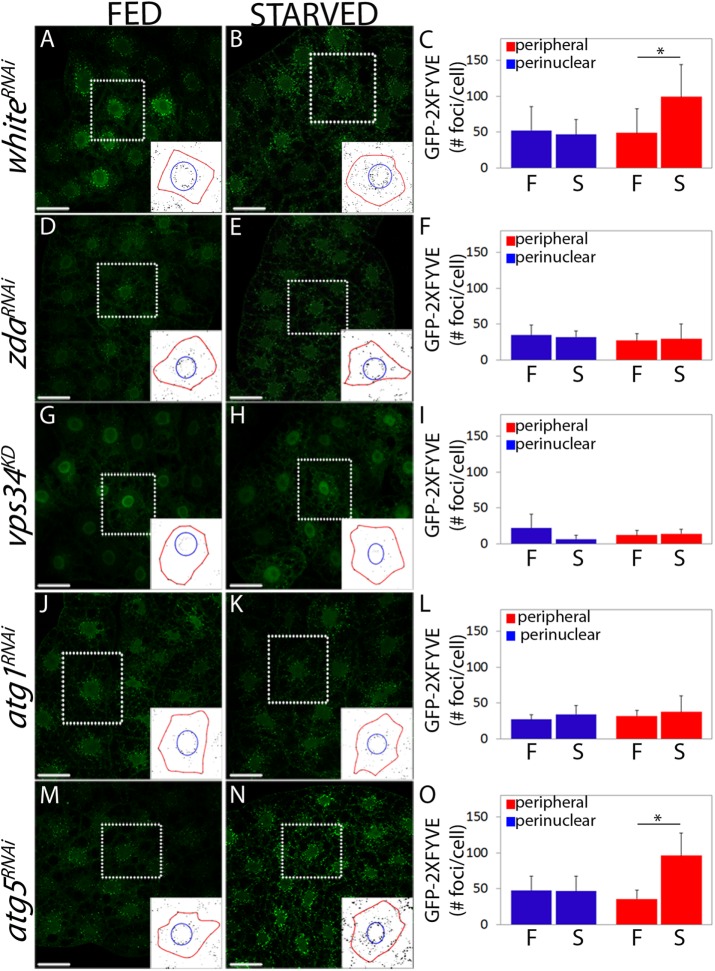
FIGURE 3:
Starvation-induced Vps34 activity requires Zda. Confocal images of fat body cells of fed (A, D, G, J, and M) or starved (B, E, H, K, and N) third instar larvae expressing the PI3P reporter GFP-2xFYVE. whiteRNAi (A and B), zdaRNAi (D and E), vps34KD (G and H), atg1RNAi (J and K), or atg5RNAi (M and N) were coexpressed. In control larvae under feeding conditions, a proportion of the GFP-2xFYVE signal was perinuclear (corresponding to endosomes), while another proportion was more peripheral (autophagosomes) (A). Following starvation, the peripheral signal of the reporter increased significantly, while the perinuclear signal remained constant (B). In larvae expressing zdaRNAi (D and E) or atg1RNAi (J and K) the GFP-2xFYVE signal did not change after starvation, indicating that autophagic activation of Vps34 was blocked. In larvae expressing atg5RNAi (M and N), starvation-induced activation of Vps34 was normal. Expression of a dominant negative form of Vps34 (vps34KD) largely suppressed the GFP-2xFYVE signal both under feeding (G) or starving (H) conditions. The insets depict how the GFP-2xFYVE signal was quantified in the perinuclear (within the blue circle) and peripheral regions (between the blue circle and the red line that marks the plasma membrane). The reporter signal (number of foci) was quantified in each of these two regions in at least 20 cells of three independent experiments (C, F, I, L, and O). Data represent mean ± SD. One-tailed, unpaired Student’s t test, p < 0.05. Scale bar: 50 μm. Number of cells counted for each genotype and condition (N): A = 8; B = 12; D = 12; E = 12; G = 9; H = 9; J = 8; K = 9; M = 9; N = 12.

