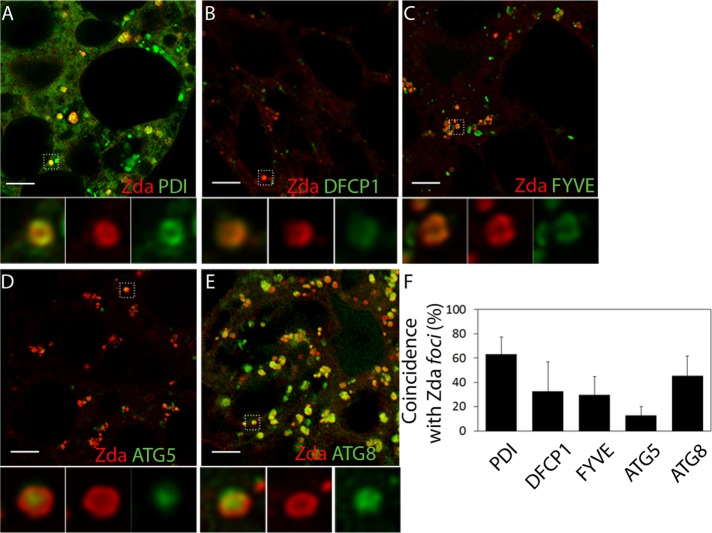
FIGURE 6:
Zonda localizes at the omegasome. Confocal images of fat body cells of starving third instar larvae coexpressing mCh-Zda along with GFP-PDI (A), GFP-DFCP1 (B), GFP-2xFYVE (C), GFP-Atg5 (D), or GFP-Atg8 (E). A magnified view of the omegasomes for each panel is shown in the insets. The percentage of colocalization between Zonda foci and each of the markers is shown in F. Zda formed rings on the ER (A–A″) that colocalized with the omegasome markers GFP-DFCP1 (B–B″) and GFP-2xFYVE (C–C″). Phagophore markers GFP-Atg5 (D) and GFP-Atg8 (E) are observed in the center of Zda-containing rings, which are presumably omegasomes. Scale bar: 5 μm. Number of fields counted for each genotype (N): A = 5; B = 6; C = 7; D = 7; E = 8.

