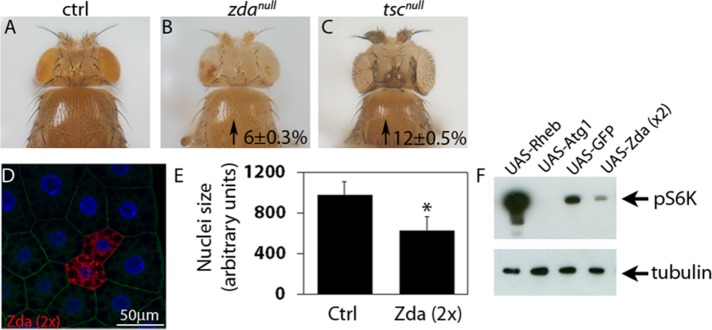
FIGURE 9:
Zonda is a negative regulator of Tor. (A–C) Representative heads of the indicated genotypes. Mutant heads were generated using eyeless-induced FLP-mediated recombination. Homozygous wild-type cells were eliminated due do the presence of a minute mutation in the recombined chromosome. In comparison to control heads (FRT82, A), zdanull heads are bigger. As a positive control, tscnull heads were generated, and they are also bigger than controls. Numbers inside panels represent the incremental percentage with respect to control heads. The increments are statistically significant, p < 0.05. (D) An example of a fat body containing wild-type and mCh-Zda–overexpressing cells is shown in D. DAPI labels cell nuclei. (E) Quantification of nuclei size of control fat body cells or Zonda-overexpressing fat body cells (UAS-Zda 2x). Zonda overexpressing cells were generated using the flip-out technique. N = 20. Two-tailed, unpaired Student’s t test, p < 0.05. (F) Western blot analysis of larval homogenates overexpressing the indicated UAS constructs using a ppl-Gal4 driver. Membranes were blotted with antibodies against phospho-S6K and tubulin. A representative membrane from three independent experiments is shown. Number of heads counted for each genotype (N): A = 30; B = 35; C = 28. Number of cells counted (N): D = 20.

