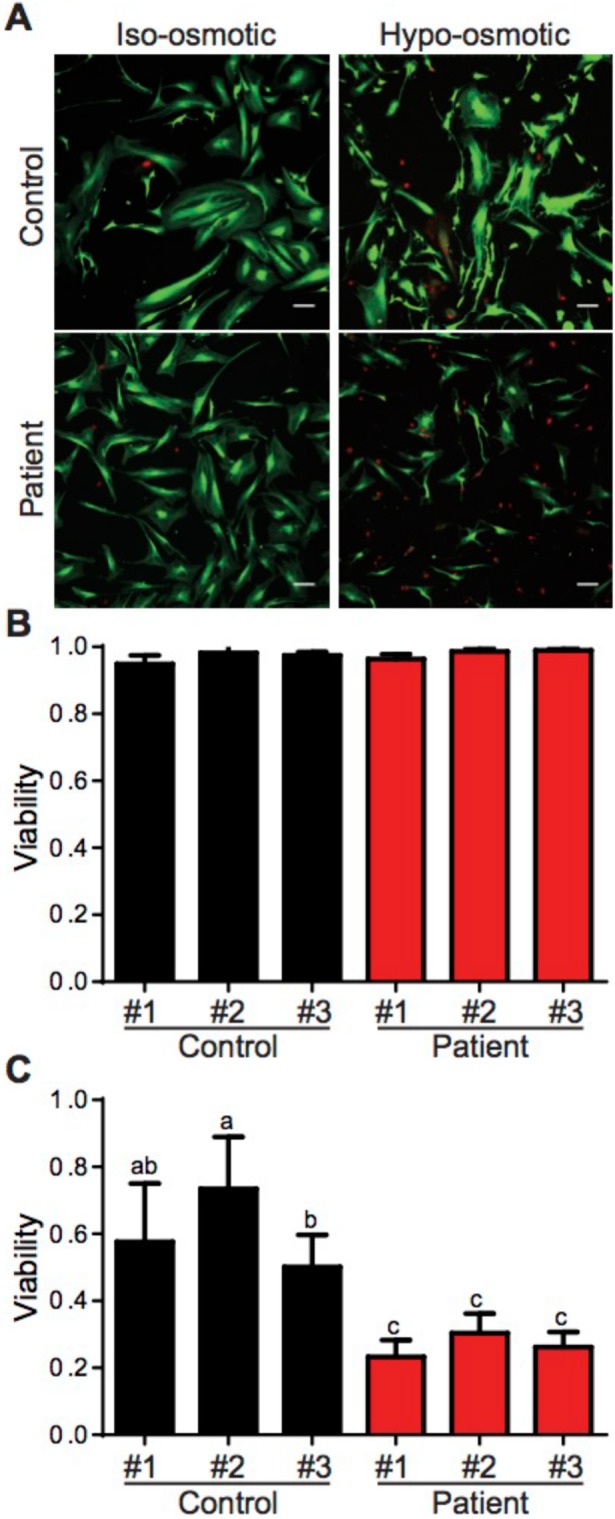
FIGURE 11:

Patient fibroblasts demonstrate increased susceptibility to hypo-osmotic stress challenge. (A) Representative images of control and patient fibroblasts before and after 10 min of hypo-osmotic challenge. Live cells are shown in green and dead cells are red. Bar, 10 μm. (B, C) Quantification of cell viability under (B) control and (C) hypo-osmotic challenge conditions. Data represent the mean ± SD of at least four independent experiments in which at least nine fields of cells were analyzed for each cell line. Results for control cell lines are shown in black and in red for patient cell lines. One-way ANOVA was used for statistical analysis. Any two means that do not share the same letter were significantly different after running the ANOVA.
