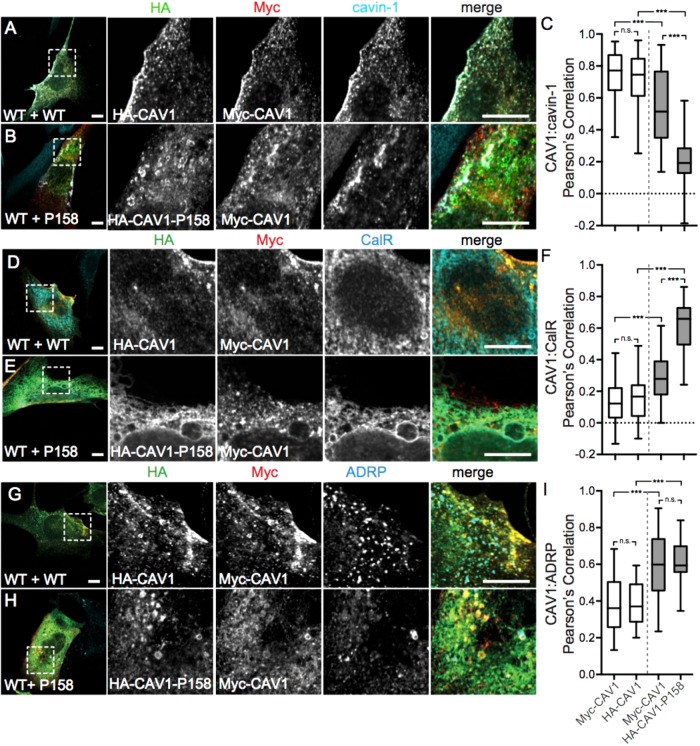
FIGURE 3:
Coexpressed WT CAV1 and CAV1-P158 partially colocalize in the ER and lipid droplets. Cav1–/– MEFs coexpressing wild-type CAV1 constructs (WT+WT, white bars in graphs) or wild-type and mutant constructs (WT+P158, gray bars in graphs) were costained with cavin-1 (A, B), calreticulin (D, E), or ADRP (G, H). WT HA-CAV1 or HA-CAV1-P158 staining is shown in green, WT Myc-CAV1 staining is red, and endogenous cavin-1, calreticulin, or ADRP staining is shown in cyan. Scale bars, 10 μm. (C, F, I) Quantification of the extent of colocalization between the indicated CAV1 constructs and cavin-1, calreticulin, or ADRP as calculated by Pearson’s correlation. Data were averaged over two to three independent experiments for the following numbers of cells: cavin-1, 114 WT/WT and 30/44 WT/P158 cells; CalR, 40 WT/WT and 39 WT/P158 cells; ADRP, 18 WT/WT and 26 WT/P158 cells. Ordinary one-way ANOVA and post hoc Bonferroni’s multiple comparisons test were performed to determine p values. n.s., not significant; ***, p < 0.001. Scale bars = 10 μm.

