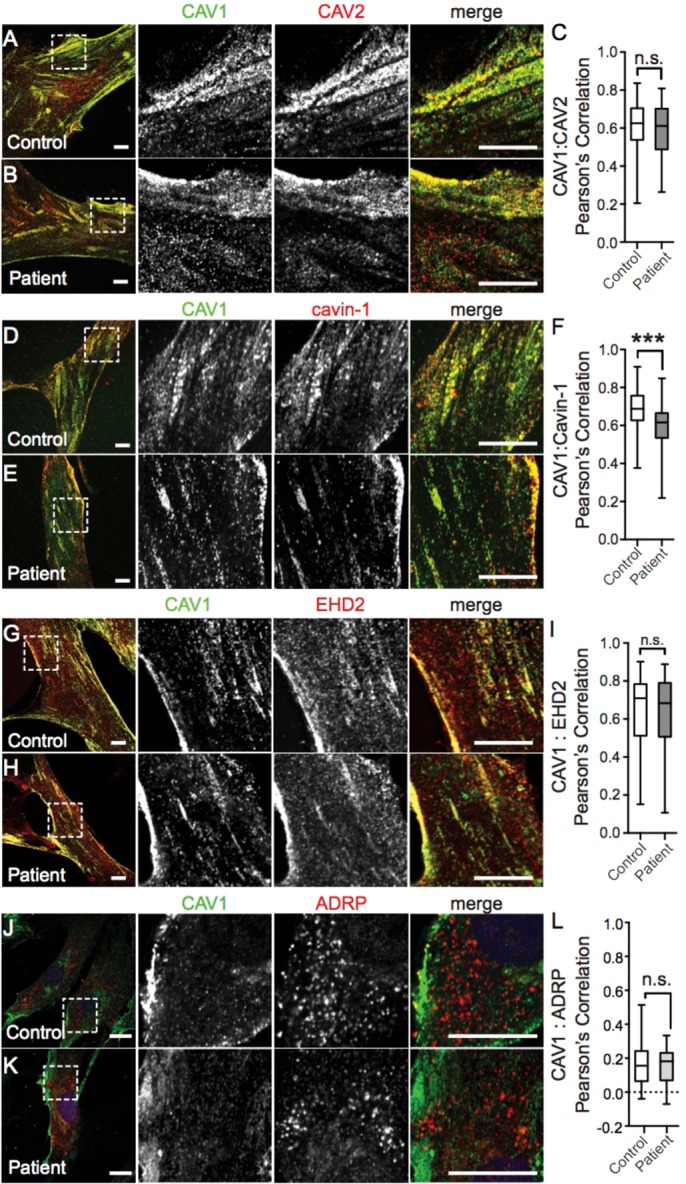
FIGURE 6:

The subcellular distribution of CAV1 and caveolaer accessory proteins is normal in patient skin fibroblasts. Representative immunofluorescence images of control and patient skin fibroblasts costained for CAV1 and CAV2 (A, B), Cavin-1 (D, E), EHD2 (G, H), or ARDP (J, K). In the merged images, CAV1 fluorescence is shown in green. Scale bars, 10 μm. (C, F, I, L) Quantification of the extent of colocalization of CAV1 and the indicated proteins using Pearson’s correlation coefficient. p values were calculated with a nonparametric two-tailed Mann–Whitney U test. Data are representative of two to three independent experiments for three control and three patient cell lines. n.s., not significant; ***, p < 0.001. The numbers of cells analyzed are as follows: CAV1/CAV2, 46 control and 46 patient cells; CAV1/Cavin-1 54 control and 61 patient cells; CAV1/EHD2 96 control and 93 patient cells; CAV1/ADRP, 41 control and 64 patient cells.
