FIGURE 9:

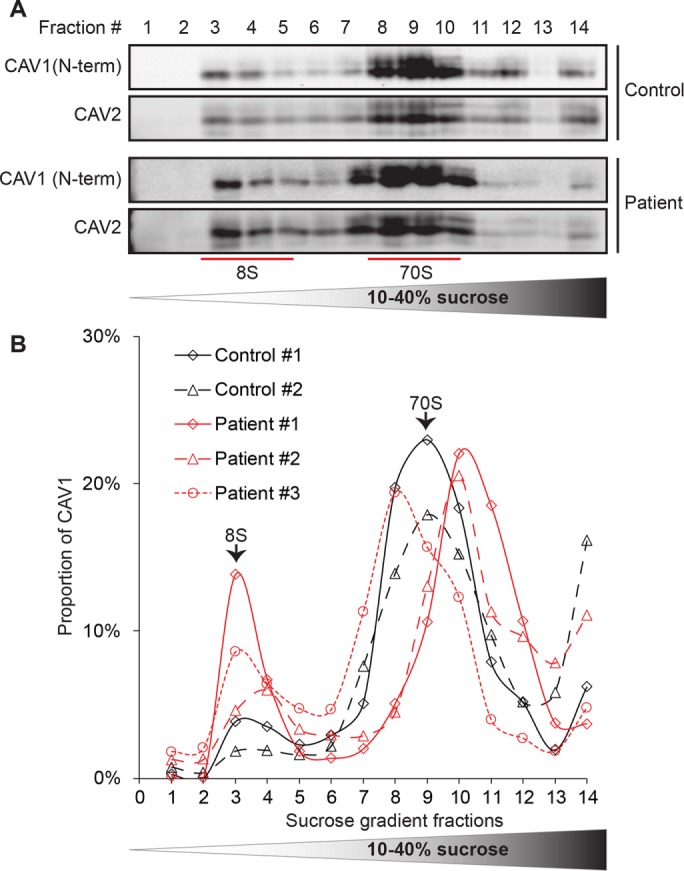
CAV1 associates normally with 8S and 70S complexes in patient fibroblasts. (A) Extracts prepared from control and patient fibroblasts were run through 10–40% sucrose velocity gradients and the resulting fractions analyzed by Western blot for CAV1 and CAV2. Both CAV1 and CAV2 associated with 8S and 70S oligomeric species in both control and patient cells. For each fraction, 10 μl of sample was loaded. Blots are shown for control cell line #1 and patient cell line #3. (B) Quantification of CAV1 levels for individual control (black lines) and patient (red lines) cell lines. Note that all three patient cells lines contained slightly larger amounts of 8S complexes than were seen in control cells. The broad range in sedimentation of the larger complex in patient cells is most likely due to technical variations between experiments rather than biological variability, as the fractions were collected by hand. Data are representative of one to two independent experiments per cell line.
