
Fig. 3.
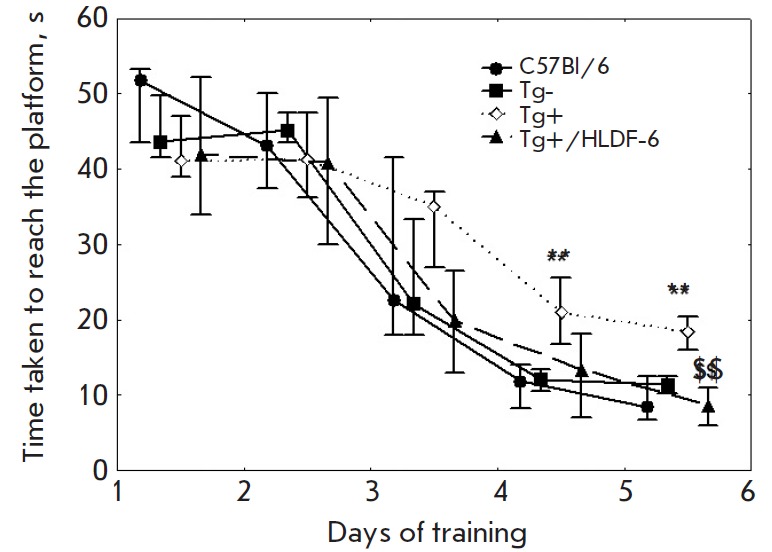
The dynamics of Morris water maze training of mice. The data are presented as the median, the upper, and lower quartiles. ** – p < 0.01 compared to the Tg-group; $$ – p < 0.01 compared to the Tg+ group.
Official websites use .gov
A
.gov website belongs to an official
government organization in the United States.
Secure .gov websites use HTTPS
A lock (
) or https:// means you've safely
connected to the .gov website. Share sensitive
information only on official, secure websites.
The dynamics of Morris water maze training of mice. The data are presented as the median, the upper, and lower quartiles. ** – p < 0.01 compared to the Tg-group; $$ – p < 0.01 compared to the Tg+ group.