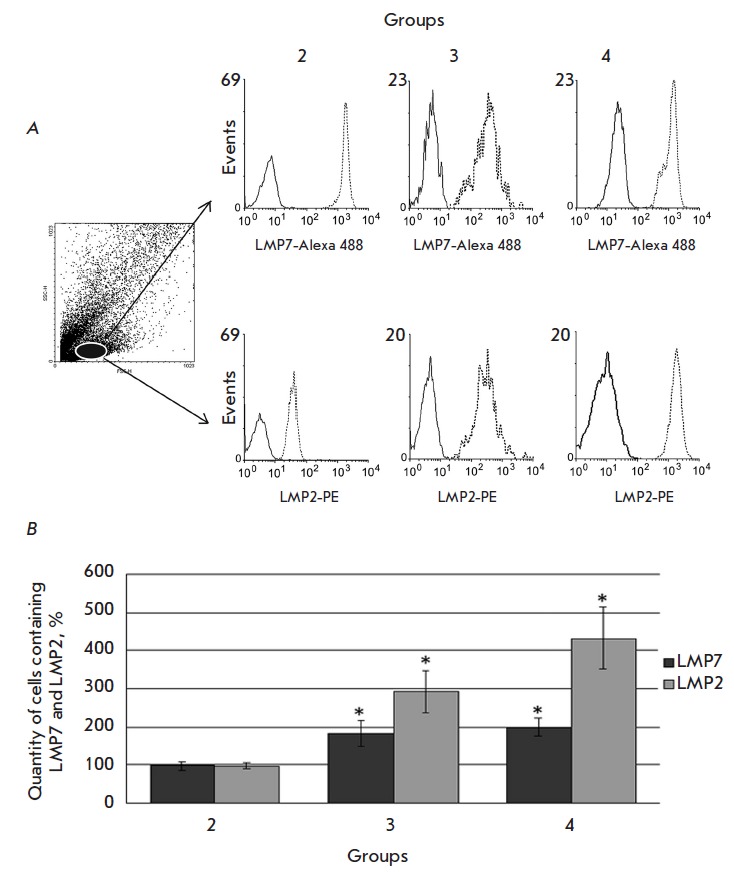
Fig. 2.

Cytofluorimetric analysis of the expression of the LMP7 and LMP2 subunits in rat liver mononuclear cells. A – In the dotted graph of forward (FSC) and side (SSC) light scattering, the subpopulation of analyzed cells is highlighted by oval. In the right part, the histograms of LMP7 and LMP2 expression in the analyzed cell subpopulation of the liver of the 2md, 3rd and 4th rat groups on the 1st day after the beginning of DST induction are presented. B – Per cent of mononuclear cells expressing the LMP2 and LMP7 subunits in the liver of the 2md, 3rd and 4th rat groups on the 1st day. In histograms: solid line – isotypical control, dashed line – experiment. The quantity of cells containing the LMP2 and LMP7 subunits in samples of the 1st group was taken as 100%. Significant difference at p < 0.05 and n = 5–6 in comparison with the 2md group is indicated (*).
