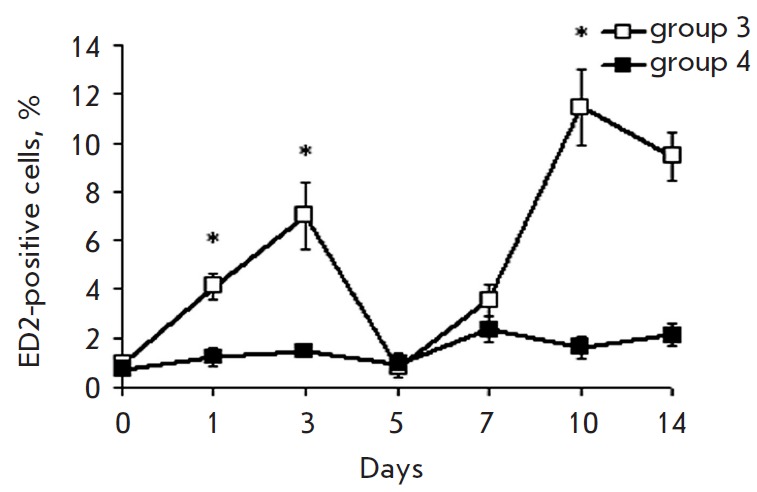
Fig. 4.

Cytofluorimetric analysis of cells expressing the macrophage ED marker in the 3rd and 4th rat groups at different stages after introduction of donor splenocytes. On x axis, days after the beginning of DST induction are shown. The quantity of cells in samples of the 1st group was taken as 100%. Significant difference at p < 0.05, n = 5 in comparison with basal level (group 1) (*).
