Fig. 1.

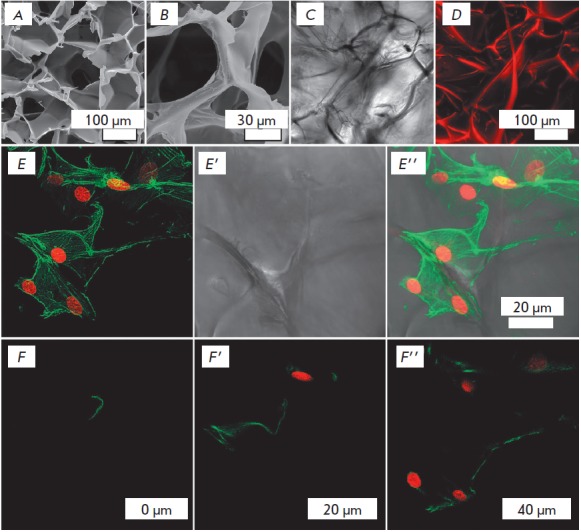
Scaffold microstructure and MEF cytoskeleton under 3D culture conditions. Scaffold images obtained by scanning electron microscopy (A–B); scaffold images obtained by transmittedlight confocal scanning in an aqueous medium (DIC, C); Z-projection of 150 optical sections of the scaffold at 1.2 μm intervals, where the scaffold material was stained with TRITC and detected using a 20x/0.75 oil immersion CFI Plan Apo VC lens (D). E–E’’ – Z-projection of 242 optical sections series at 281 nm intervals (68.002 μm) of MEF cultured on a 3D scaffold. F–F’’ – Optical sections obtained 0 (F), 20 (F’) and 40 (F’’) μm apart from the initial scanning position. The cell cytoskeleton was stained with phalloidin-FITC (green), and nuclei were stained with SYTOX orange (red). CLSM images were acquired using a Apo TIRF 60x/1.49 oil DIC objective.
