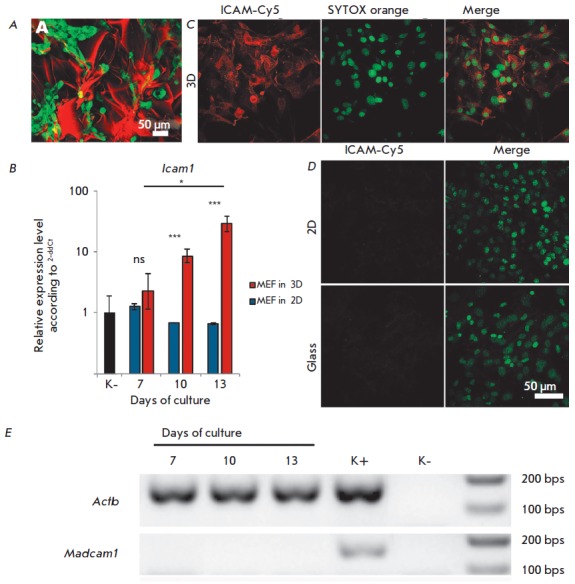
Fig. 2.

ICAM-1 expression in MEF. A – Distribution of GFP+ MEF cultured on a 3D fibroin-gelatin scaffold. The scaffold was stained with TRITC. B – Icam1 expression in MEF cultured on a 2D (plastic) and 3D fibroin-gelatin scaffold. The values were normalized on the baseline Icam1 expression level in MEF (labeled as “K-”). The data is representative of three independent experiments. * – p < 0.05; *** – p < 0.001; ns – non-significant difference. C, D – Immunofluorescence staining of ICAM-1 in MEF cultured on a 3D scaffold (C), 2D fibroin film (D, top row), and on a culture plastic surface (D, lower row). CLSM images were acquired using CFI Plan Apo VC 20x/0,75 lens. E – Expression of the Madcam1 gene in MEF cultured on a 3D fibroin-gelatin scaffold. Agarose gel electrophoresis of PCR products with specific primers to the specified genes is shown. Positive control (K +) – the material from murine lymph nodes; negative control (K-) – no cDNA was added to the PCR mix.
