. 2017 Oct 23;6:e29089. doi: 10.7554/eLife.29089

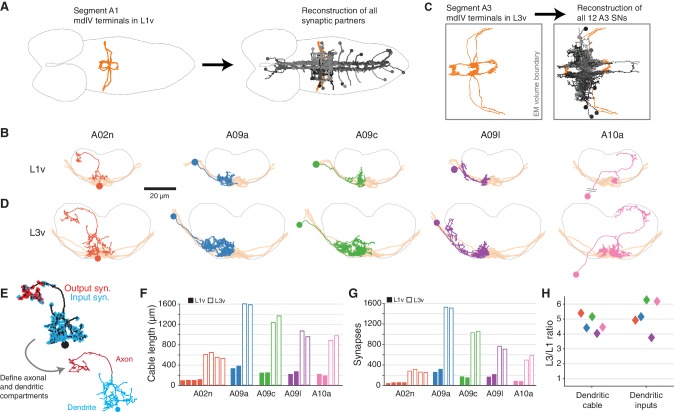
Figure 2. Morphology and properties of second-order nociceptive LNs.

(A), Starting from the synapses of the mdIVs in segment A1 of the L1v, we reconstructed all synaptic partners (grays). See Figure 2—figure supplement 1 for details of each cell type. Dorsal view, gray outline indicates CNS boundary; anterior is to left. (B) Examples of the anatomy of all five classes of LNs from the L1v. Posterior view; gray outline indicates neuropile boundary, orange shows mdIV position. (C) Based on the mdIV reconstructions in the L3v (orange), we reconstructed the same populations of all mdIV LNs in segment A3 (grays; 12 LN cells in total). (D) Examples of the anatomy of all five classes of LNs from the L3v, shown as in B. (E) All neurons were split into axonal and dendritic compartments based on well-separated synaptic input and output domains. The example shown is the A02n from D. (F), Total dendritic cable length for all LNs. (G) Number of synaptic inputs onto LN dendrites. (H) Fold-change in dendritic cable length and dendritic synaptic inputs between the L1v and L3v LNs.

Figure 2.

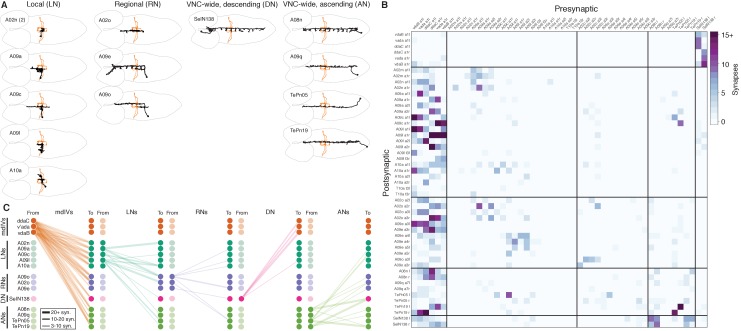
Figure 2—figure supplement 1. The complete second-order mdIV network from the L1v.

Figure 2—figure supplement 1.

(A) All cell types synaptically connected to mdIV terminals in the L1v. Cell types were organized by spatial extent of the dendrites. Dorsal views of a single example of each interneuron cell type (black) and the mdIV terminals of segment A1 (orange), anterior to left. Outline indicates CNS boundary. Local neurons (LNs) had dendrites spanning 1–2 segments, regional neurons (RNs) had dendrites spanning 3+ segments but not the whole VNC, a descending neuron (DN) had dendrites in subesophageal zone (SEZ) and an axon in VNC, and ascending neurons (ANs) had cell bodies in the posterior tip and projections that spanned the entire VNC toward the brain. See Supplemental Atlas for more views of cell types. (B) Connectivity between individual cells in the mdIV network expressed as an adjacency matrix. Entries indicate the number of synaptic contacts from the column neuron to the row neuron. Black lines separate mdIV/LN/RN/DN/AN classes. Note that mdIV order is clockwise from ventral left. (C) Connectivity between cell types in the mdIV network. Each column indicates connections from cell types in the left category to all cell types. Line thickness indicates number of synapses. Connections not observed at least twice at a 3+ synapse level are not shown here. In addition to the LN networks discussed elsewhere, we also find a strong pathway for feedback regulation of mdIV terminals. The SEZ neuron SeIN138 has an axonal projection descending through every abdominal segment, along which it both receives synaptic input from and outputs back onto mdIV terminals of all subtypes, offering a local axo-axonal feedback pathway across just a few microns of axonal arbor. Interestingly, SeIN136 also receives dendritic input near the SEZ from two ascending mdIV projection neurons, A08m and TePn19, that receive mdIV input throughout the nerve cord. This mdIVANDNmdIV pathway could allow every mdIV terminal across the body to be presynaptically regulated by ascending nociceptive input coming from any one location on the body. No other cell type was strongly or consistently pre-synaptic to mdIV terminals, suggesting this is the only such direct pathway.
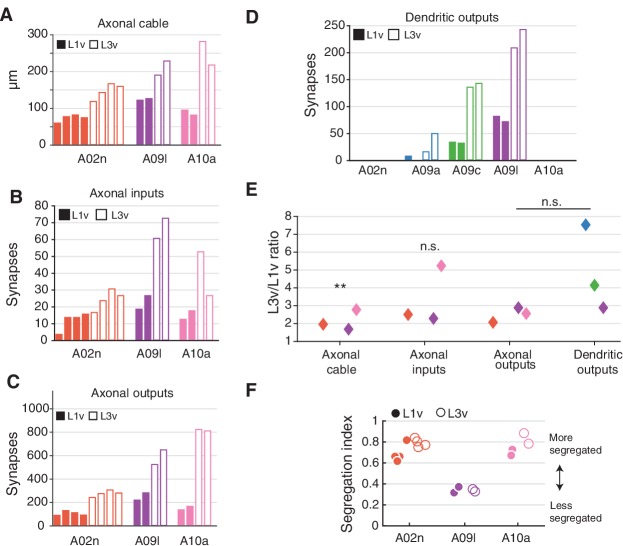
Figure 2—figure supplement 2. Additional LN properties.

Figure 2—figure supplement 2.

(A) Total axonal cable length for A02n, A09l, and A10a. The LNs A09a and A09c had incomplete axons in the L3v due to the limited extent of the image volume and are omitted from axon-related analysis here. (B) Number of synaptic inputs onto LN axons. (C) Number of axonal outputs for LNs. (D) Number of synaptic outputs on the dendrites of each LN. All neuron types that exhibited dendritic outputs in the L3v also had them in the L1v, suggesting that all of the basic categories of connections are preserved. (E) Fold-change between the L1v and L3v for the properties in A–D. Colors correspond to cell types. Axonal cable scales significantly less than dendritic cable (p=0.009, two sided t-test with Bonferroni correction), though other differences between axonal and dendritic property scaling are not significant. (F) Segregation index for complete LNs, which measures the degree of input/output segregation of a neuron (one indicates a completely segregated neuron, with all outputs in one region and all inputs in another; 0 indicated a neuron with completely intermixed inputs and outputs. See Materials and methods for precise definition.) Note that segregation index is generally maintained as a cell type-specific property across larval stages.