Figure 3. Connectivity of second-order nociceptive LNs is topographically arranged and consistent across larval development.
(A) Number of synaptic inputs onto LNs from mdIV terminals in the same segment. (B) Normalized dendritic synaptic input from mdIV terminals for each LN. (C) Fold-change in number of synapses and normalized synaptic inputs from mdIVs for each LN type. (D) Heatmap of normalized dendritic input from each mdIV terminal onto each LN for L1v (left) and L3v (right). Note that mdIV terminals are ordered clockwise from ventral left. (E) Normalized dendritic input from mdIVs onto LNs is strongly correlated across animals and developmental time points. Each data point corresponds to average normalized dendritic input from an mdIV type onto an LN type. (Pearson’s r = 0.77, p0.001 to be different from zero). (F) Asymmetry between normalized mdIV synaptic input into left and right LNs, measured as coefficient of variation. Asymmetry in the L3v is significantly lower (p=0.006, paired two sided t-test). (G) Cartoon of the larval body wall viewed from posterior. The dendritic receptive field of each mdIV covers approximately 1/6 of the circumference of the animal. (H) Mean body wall orientation of mdIV input into each LN in the L1v (left) and L3v (right), computed as the average of unit vectors pointing at the center of each mdIV dendrite receptive field, weighted by number of synaptic inputs from that neuron. Arrow color corresponds to LN type. n.s. not significant; *p0.05. **p0.01. ***p0.001.

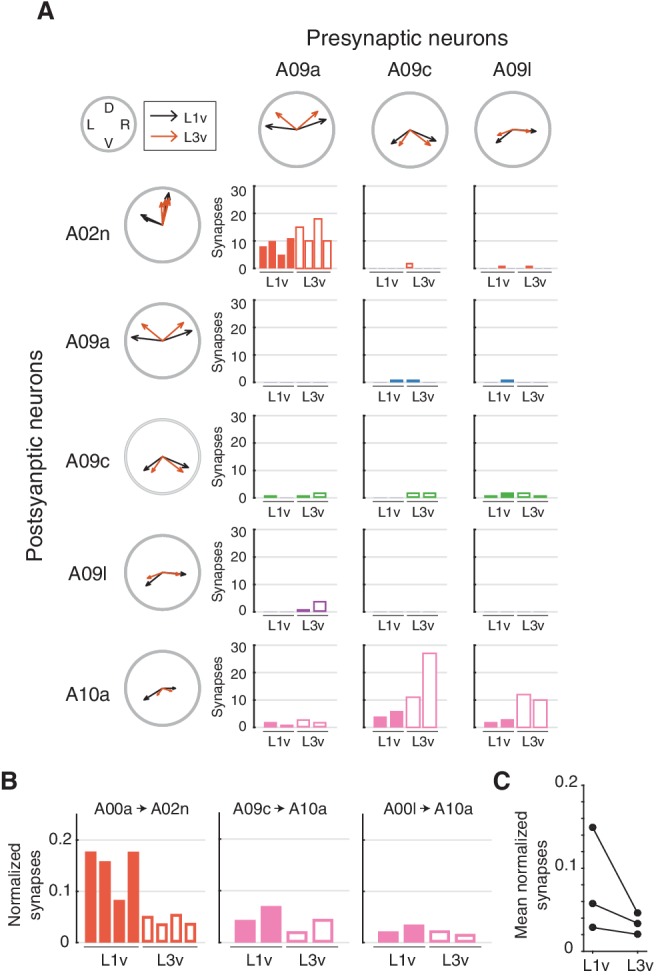
Figure 3—figure supplement 1. Topographically structured feed-forward connectivity between mdIV-related LNs.