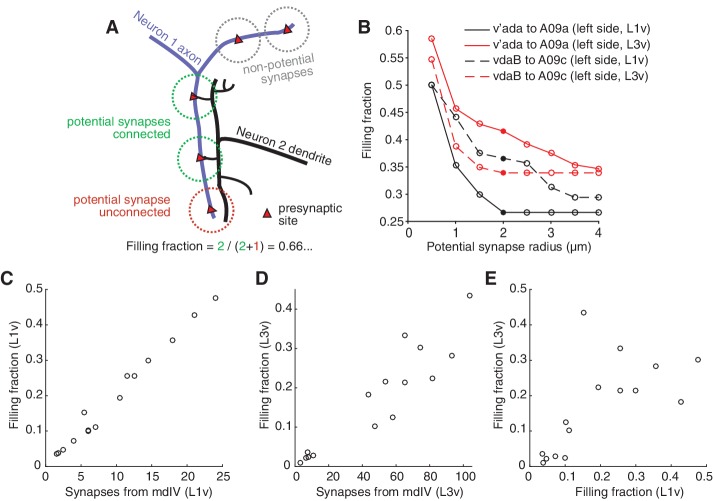
Figure 4. Numerically strong connections are associated with stereotypically high filling fraction.
(A) Description of 'filling fraction’ for a connection from Neuron 1 (purple) to Neuron 2 (black). Neurons can only be connected where they are adjacent to one another in space. A pre-synaptic site on Neuron 1 is a potential synapse from Neuron 1 to Neuron 2 if any part of Neuron 2 passes within a given radius (dashed circles). Filling fraction is defined as the number of potential synapses (red and green dashed circles) that are actually connected (green dashed circles only). (B) Dependence of filling fraction on the potential synapse radius for four example connections. For subsequent figures, we chose 2 m (filled circles) as a compromise between the typical size of a terminal branch and a shoulder in the filling-fraction versus radius curve. (C–D) Mean filling fraction vs. mean number of synapses in the L1v (C) and L3v (D). Each data point represents the average value for connections from mdIV types onto LN types. The high correlation in both (L1v, Pearson = 0.99, p0.001 different from zero; L3v, Pearson = 0.93, p0.001) suggests that increased connection probability, not merely access to differing numbers of pre-synaptic synapses, helps set cell type-specific differences in synaptic counts. (E) Filling fraction of mdIV type to LN type connections in the L1v and L3v are significantly correlated with one another (Pearson = 0.64, p=0.009).

