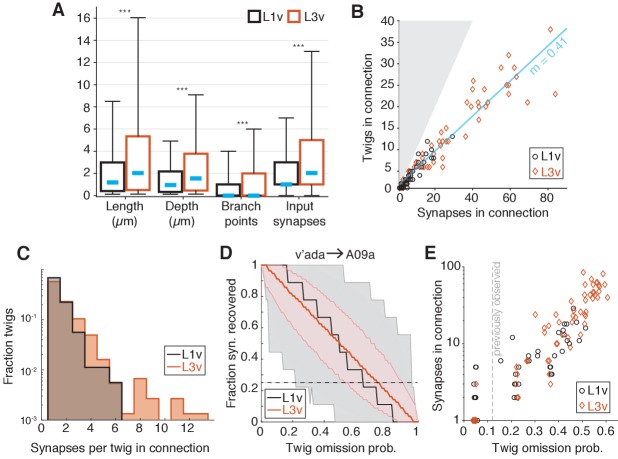
Figure 6. Twig properties across postembryonic development.
(A) Distribution of morphological and synaptic properties of distinct twigs in the L1v and L3v LNs. Total twig length and maximum twig depth are in m, branch points and synapses are integer. Boxes are interquartile intervals, blue dashes are median values, and whiskers correspond to 5/95 percentiles. Wilcoxon rank sum test with Bonferroni correction. (B) Number of distinct twigs in a connection versus number of synapses in the same connection. The blue line indicates a linear fit to connections with five or more synapses (slope shown). The gray region corresponds to the disallowed situation of more twigs connected than synapses. (C) Histogram of number of synapses per twig in each mdIVLN connection. (D) The fraction of synapses in the connection from a v’ada to an A09a in the L1v (9 synapses onto twigs) and L3v (56 synapses onto twigs) recovered after simulated random omission of twigs (N = 5000 instances), as a function of omission probability. Thick lines show median value, shaded region the 5/95 percentile value. The dashed horizontal line indicates the 25% of synapses recovered. (E) Maximum error rate permitting the recovery of 25% of synapses with probability 0.05 for each observed mdIVLN connection (i.e. where the horizontal dashed line crosses into the shaded area in D). Each data point is a single mdIV axon’s synapses with a single LN. The vertical line indicates the error rate for twigs found previously for manual annotation of motor neurons (Schneider-Mizell et al., 2016). n.s. not significant; *p0.05. **p0.01. ***p0.001.
Figure 6—figure supplement 1. Individual twig properties, broken down by LN cell type.


