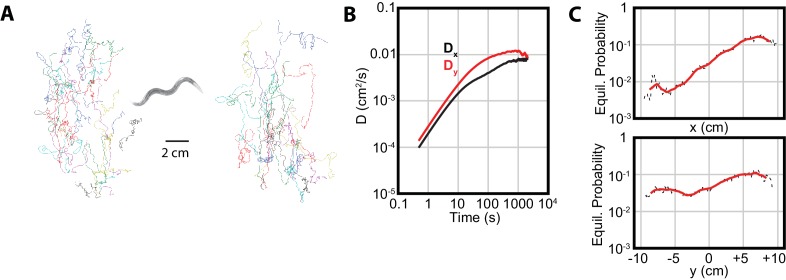
Figure 4. Isothermal tracking in C. elegans includes diffusion in the -direction.
(A) Experimental trajectories under temperature gradient conditions, with worms initially placed at their cultivation temperature of 15°C. Colors are used for the reader to distinguish between individual tracks. (B) The diffusion constants along the and directions, with dominating, but highly significant. Error bars are s.e.m. (C) MSM-generated equilibrium probabilities along the temperature gradient ( axis) showing the long time scale distribution of the population of worms, and perpendicular to the temperature gradient along isotherms ( axis). In , worms avoid regions with low temperatures, but freely explore regions with higher temperature; in , worms explore the axis with approximately equal probability. Analysis based on 25 experiments, with 688 tracks.

