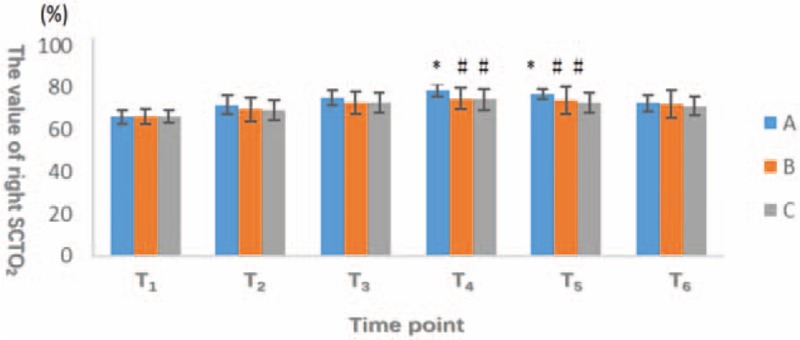
Figure 1.

The horizontal axis represents different observation points, and the vertical axis indicates the number of SCTO2 of right and left sides of brain. The oxygen saturation of the patients in group A was significantly higher than that in group B and group C (P < .05) at the time of T4 and T5. There was no significant difference (P > .05) at other time points among 3 groups. SCTO2 = cerebral oxygen saturation.
