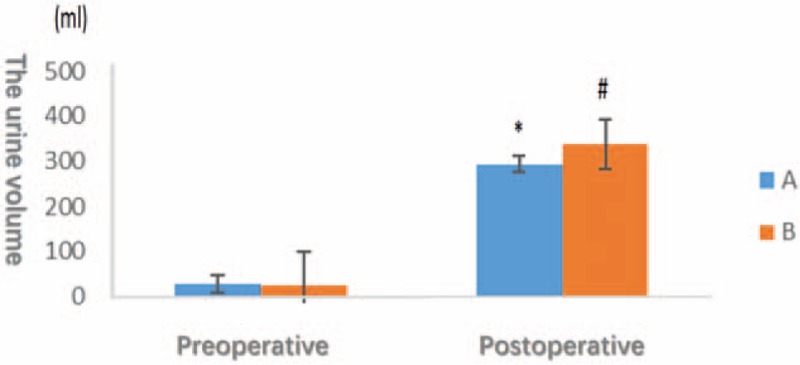
Figure 6.

The horizontal axis indicates different times, the vertical axis represents the urine volume of the patients undergoing gynecological endoscopic surgery. There is no significant difference between 2 groups before operative (P > .05). The urine volume in group B is significantly higher than in group A after operative.
