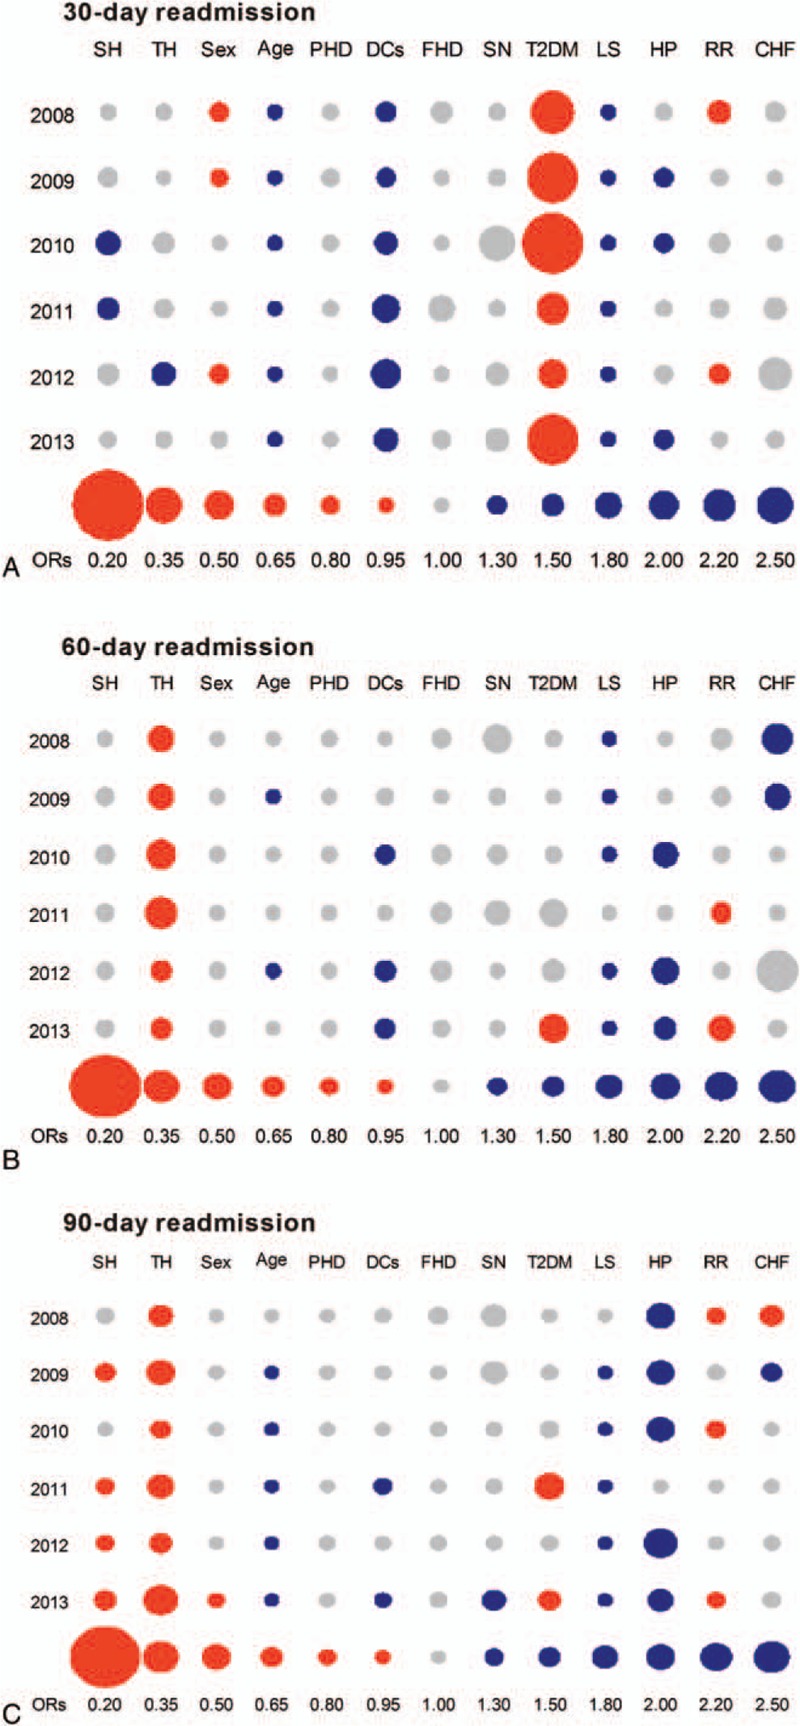
Figure 1.

The effect factors for 30-, 60-, and 90-day readmission rates in each year. (A) shows the effect factors for 30-day readmission rates from 2008 to 2013. (B) shows the effect factors for 60-day readmission rates for 2008 to 2013. (C) shows the effect factors for 90-day readmission rates from 2008 to 2013. The dark blue solid circles indicate the ORs that were significantly higher than 1 in each year (P < .05), the orange solid circles indicate the ORs that were significantly lower than 1 in each year (P < .05), and the gray solid circles indicate the ORs that were insignificant (P > .05). CHF = congestive heart failure, DCs = diabetes complications, FHD = family history of diabetes, HP = hypertension, LS = length of stay, PHD = previous diagnosed diabetes, RR = reimbursement ratio, SH = secondary hospitals, SN = screening history of diabetes, T2DM = type 2 diabetes, TH = tertiary hospitals.
