Figure 2.

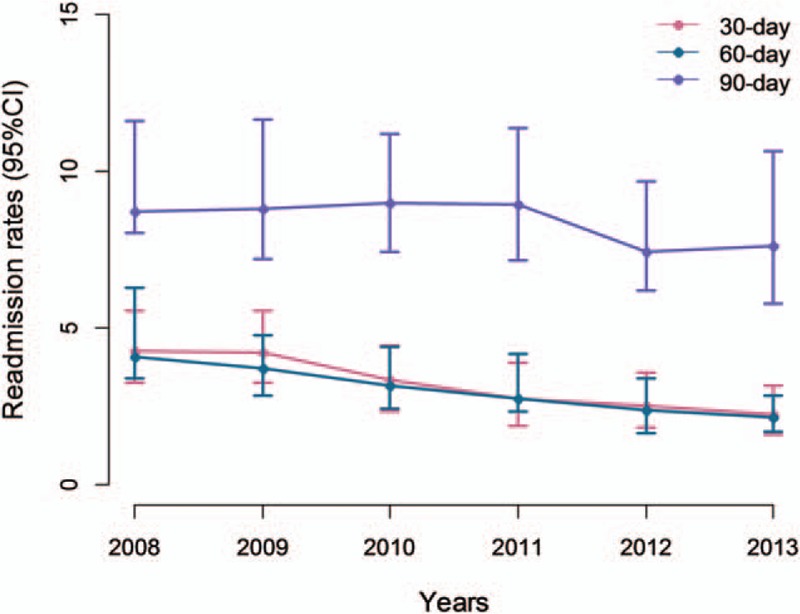
The variation of readmission rates between 2008 and 2013. The solid dots indicate the predicted readmission rates and the bars indicate 95% confidence interval at 30, 60, and 90-day intervals in each year. CI = confidence interval.

The variation of readmission rates between 2008 and 2013. The solid dots indicate the predicted readmission rates and the bars indicate 95% confidence interval at 30, 60, and 90-day intervals in each year. CI = confidence interval.