
Figure 3.
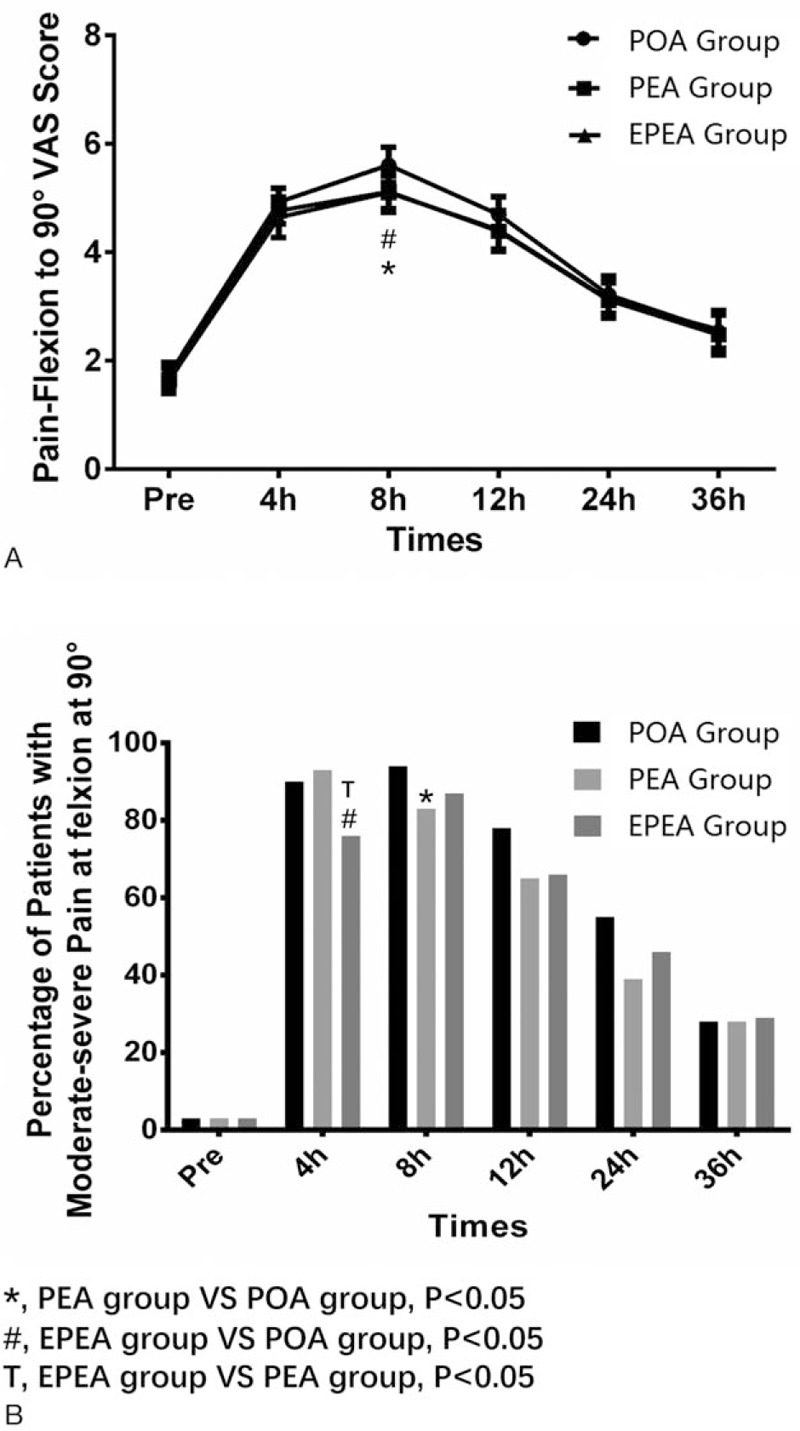
Comparison of the pain-flexion to 90o VAS scores and the percentage of patients with moderate-severe pain at flexion to 90o among EPEA group, PEA group, and POA group. (A) Comparison of the pain-flexion to 90o VAS scores among EPEA group, PEA group, and POA group. (B) Comparison of the percentage of patients with moderate-severe pain at flexion to 90o among EPEA group, PEA group, and POA group. Comparison between groups was performed by t test. P < .05 was considered significant. EPEA = early preoperative analgesia, PEA = preoperative analgesia, POA = postoperative analgesia, VAS = visual analogue scale.