
Figure 2.
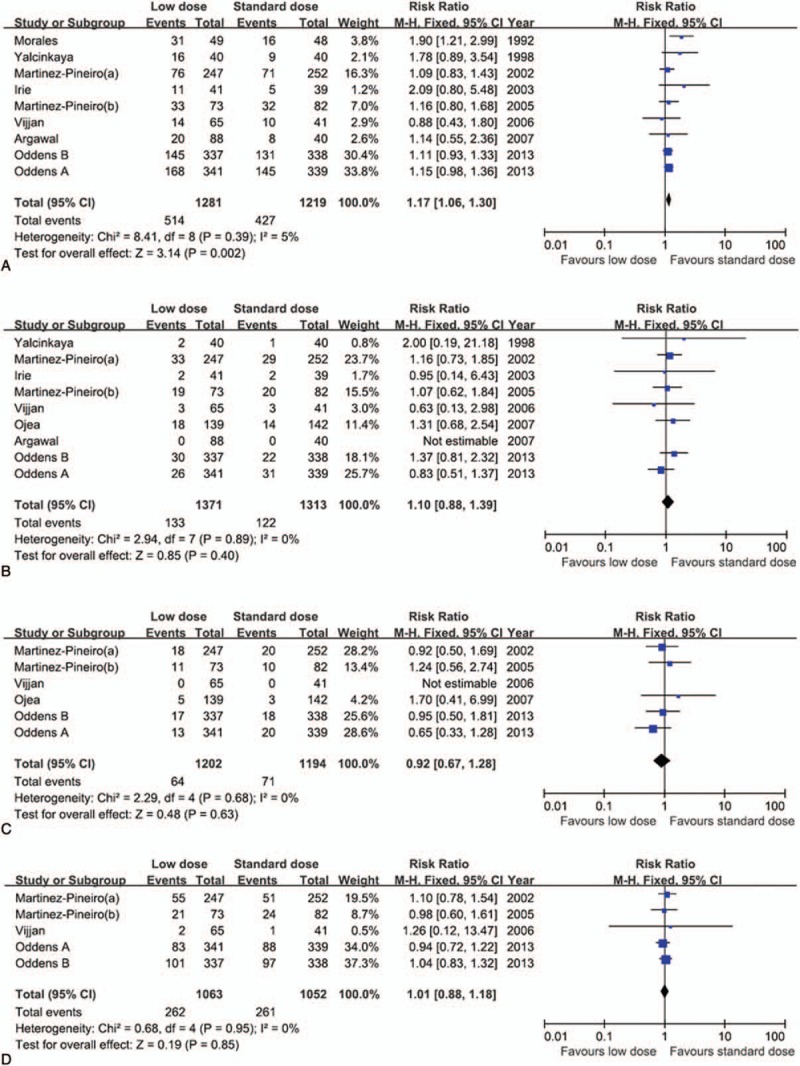
Forest plots of the prognosis of bacillus Calmette–Guerin (BCG) dose. The horizontal lines correspond to the study-specific hazard ratio and 95% confidence interval, respectively. The area of the squares reflects the study-specific weight. The diamond represents the results for pooled hazard ratio and 95% confidence interval. (A) recurrence-free survival, (B) progression-free survival, (C) cancer-specific survival, and (D) overall survival.