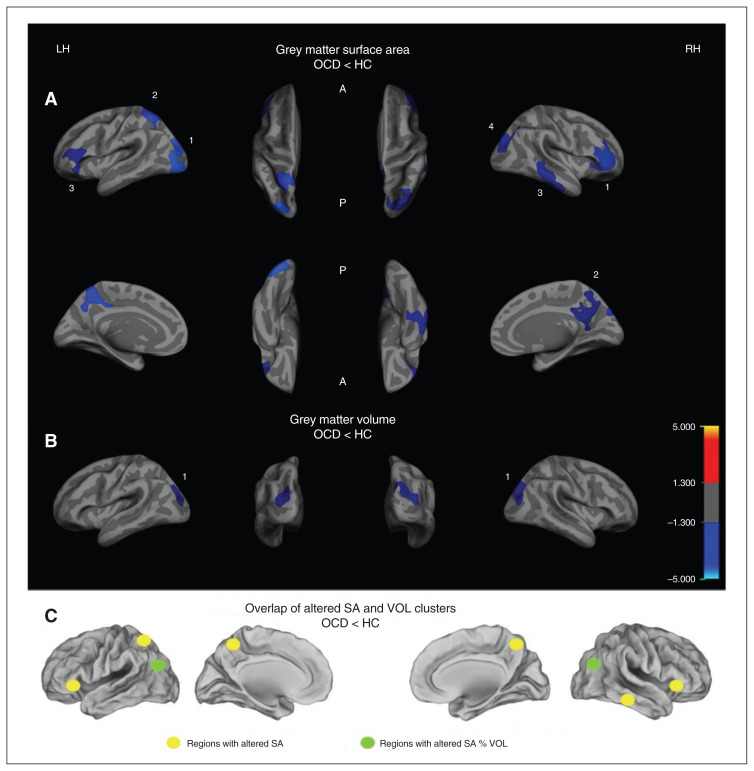
Fig.1.
Group differences in (A) clusters with significantly reduced grey matter surface area (SA) and (B) clusters with significantly reduced grey matter volume (VOL), shown separately for the right (RH) and left hemispheres (LH). Clusters are displayed on the FreeSurfer main surface of the participants’ average brain (lateral, medial, dorsal or ventral view). The colour bar indicates the t-value after cluster-wise correction for multiple comparisons using Monte Carlo simulations (p < 0.05). (C) Overlap between the altered SA and VOL clusters. Cluster numbers correspond to those in Table 3 and in the article text. A = anterior; HC = healthy controls; OCD = obsessive–compulsive disorder; P = posterior.

