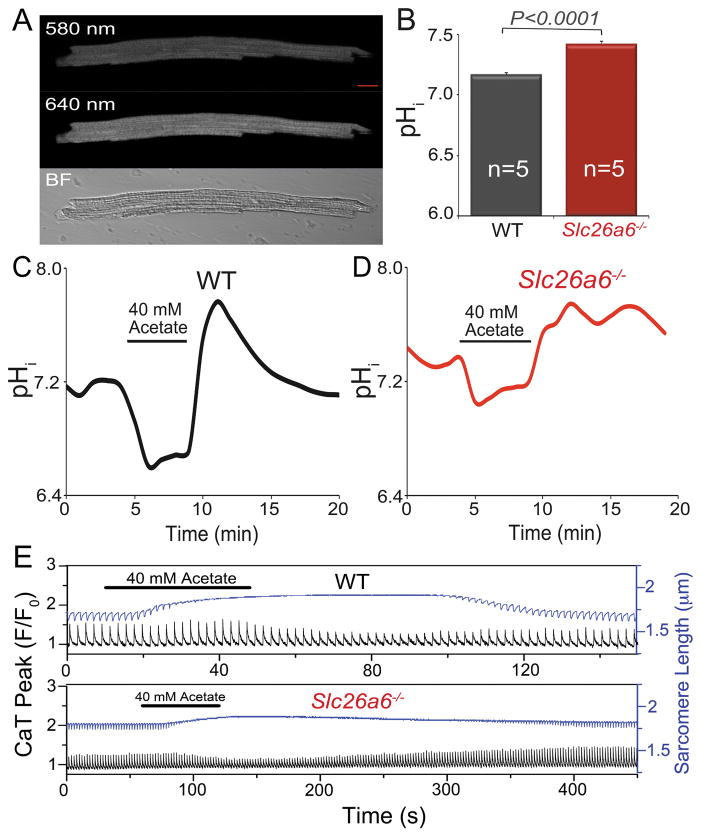
Figure 3. Slc26a6−/− cardiomyocytes show higher intracellular pH (pHi).
A. Measurement of pHi in ventricular myocytes by SNARF-1 AM using confocal microscopy (scale bar: 10 μm). Loaded cells were excited by 488 nm laser and images were acquired by using two band-pass filters with center wavelengths of 580 nm and 640 nm, respectively. The ratio of the emission signals at 580 nm and 640 nm was calculated and converted to pH value following the standard methods described before15–17. A bright field (BF) image of the cardiomyocyte was also shown at the lower panel. B. Comparisons of pHi between WT and Slc26a6−/− cardiomyocytes. Alternations and recoveries of pHi when 40 mM acetate was applied in WT (C) and Slc26a6−/− (D) ventricular myocytes. EIPA (5 μM) was added to inhibit the Na+/H+ exchanger during acetate application. E. Effects of 40 mM acetate on the CaT and sarcomere length in WT and Slc26a6−/− ventricular myocytes. EIPA (5 μM) was added to inhibit the Na+/H+ exchanger during acetate application. The recovery process after wash out of acetate for Slc26a6−/− myocytes is much slower than that of WT myocytes. The black traces showed the CaT, and the blue traces showed the sarcomere length.

