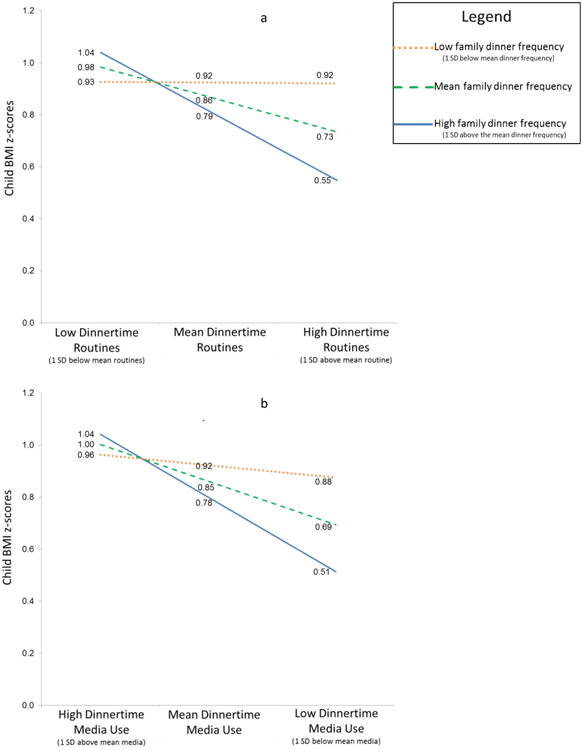
Figure 1.

Interaction plots of predicted child BMI z-scores at specified values of family dinner frequency and Family Dinnertime Routine scores (shown in Figure 1a) or Parent Dinnertime Media Use scores (shown in Figure 1b) from the HOME Plus study (n=160). SD=Standard deviation.
