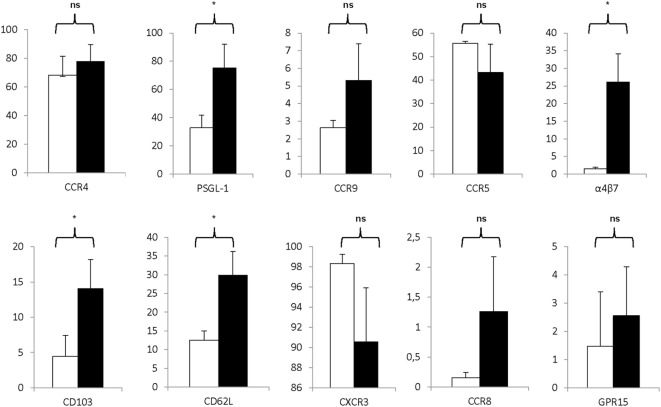
Figure 6.
Markers associated with homing are significantly expressed on the regulatory T cell (Treg) drug product. Proportion of CD25+ cells at day 0 (white bars) and day 21 Treg drug product cells (filled bars) expressing CCR4 (n = 4), PSG-1 (n = 4), CCR9 (n = 4), CCR5 (n = 4), α4β7 (n = 4), CD103 (n = 4), CD62L (n = 4), CXCR3 (n = 4), CCR8 (n = 4), and GPR15 (n = 4). NS, not significant, *P < 0.05.

