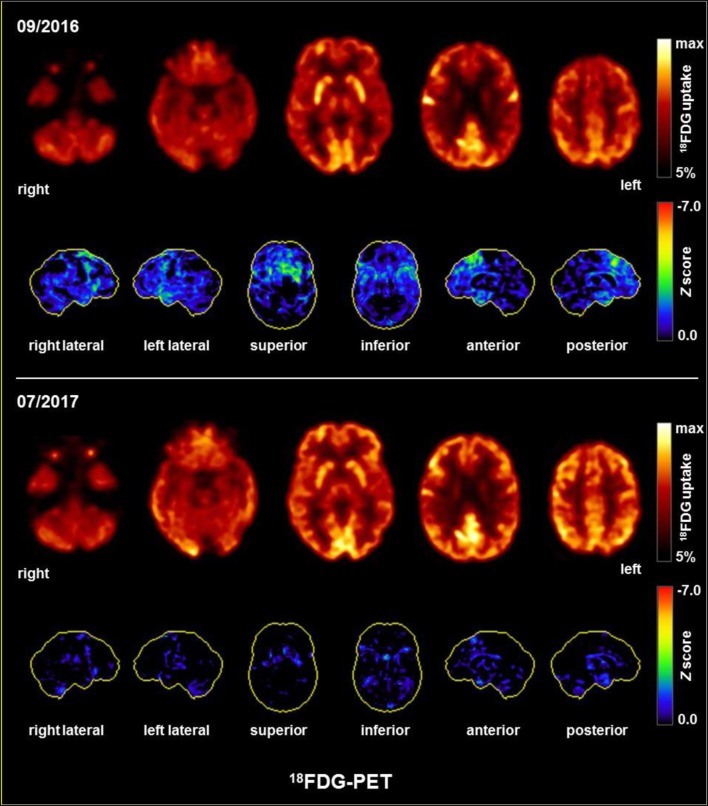
Figure 3.
FDG-PET showing mild-to-moderate medial and superior dorsolateral frontal hypometabolism before and normalization after plasmapheresis. The upper and lower row images show the transaxial fluorodeoxyglucose positron emission tomography (FDG-PET) images and the 3D surface projections of the regions with decreased FDG uptake (color-coded Z-score and compared with age-matched healthy controls, respectively).

