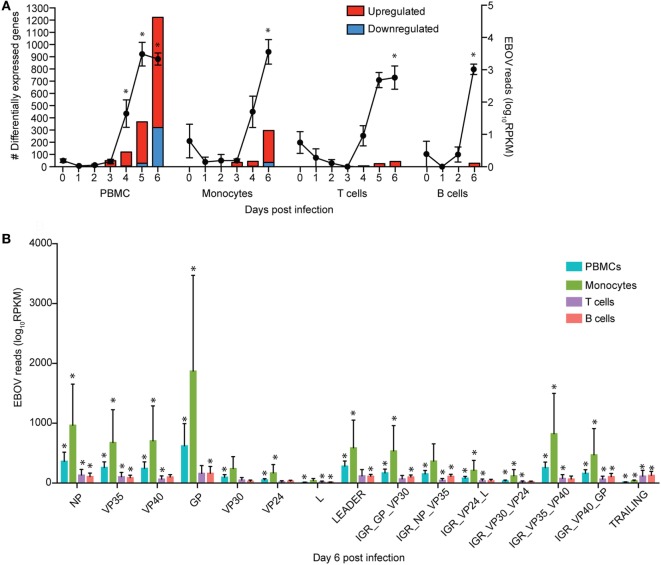
Figure 1.
Monocytes support ZEBOV-Makona replication and are major contributors of inflammation. (A) Bar graph depicts number of protein coding differentially expressed genes (DEGs; defined as those ≥2 fold change and false discovery rate (FDR) corrected p-value ≤ 0.05 compared to 0 DPI) that have human homologs (red indicates upregulated while blue indicates downregulated DEGs) in peripheral blood mononuclear cells (PBMC), monocytes, T cells, and B cells. Line graph represents number of normalized viral transcripts (RPKM); mean ± SEM are shown; * p ≤ 0.05 compared to day 0. (B) RPKM normalized RNA sequencing reads mapping to each ZEBOV open reading frame (ORF), intergenic region (IGR), as well as leader and trailing sequences 6 DPI within PBMC, monocytes, T-cells, and B-cells. FDR adjusted p-value was obtained following EdgeR analysis; mean ± SEM are shown; *p ≤ 0.05 compared to day 0.

