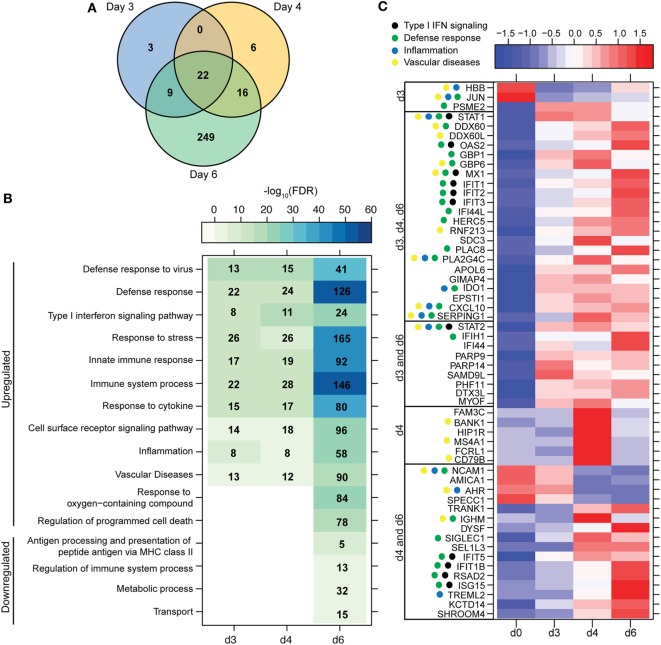
Figure 2.
ZEBOV-Makona infection induces expression of genes involved in defense response and Type I IFN signaling in monocytes. (A) 3 way Venn diagram displaying overlap between differentially expressed genes (DEGs) detected 3, 4, and 6 DPI in purified monocytes. (B) Heatmap representing functional enrichment of DEGs 3, 4, and 6 DPI; color intensity represents the statistical significance (shown as negative log10 of the false discovery rate (FDR)-corrected p-value); range of colors is based on the lowest and highest –log10(FDR) values for the entire set of terms; the number of DEGs mapping to each functional enrichment term each day is listed within each box; blank boxes represent no statistical significance. (C) Heatmap representing gene expression (shown as absolute normalized RPKM values) of all DEGs detected 3 and 4 DPI; genes enriching to Gene Ontology or disease term are indicated by colored dot; range of colors is based on scaled and centered RPKM values of the entire set of genes (red represents increased expression while blue represents decreased expression); each column represents the median RPKM values for each DPI.

