Figure 6.
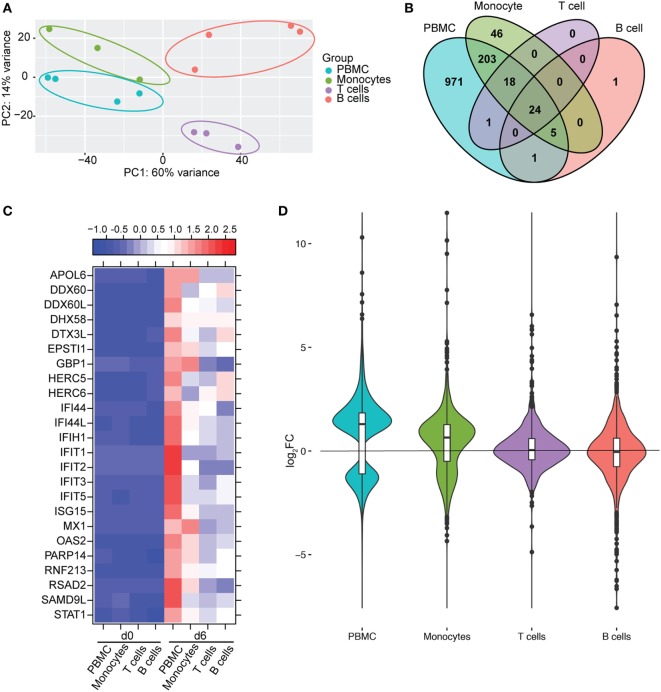
Monocytes contribute a significant proportion of transcriptional changes detected in peripheral blood mononuclear cells (PBMC). (A) Principal component analysis of normalized transcript numbers 6 DPI in PBMC, monocytes, T-cells, and B-cells. (B) 4 way Venn diagram showing overlap between differentially expressed genes (DEGs) detected 6 DPI in PBMC, monocyte, T-cells, and B-cells. (C) Heatmap representing gene expression (shown as absolute normalized RPKM values) of the 24 DEGs detected in PBMC as well as purified monocytes, T- and B-cells 6 DPI; range of colors is based on scaled and centered RPKM values of the entire set of genes (red represents increased expression while blue represents decreased expression); each column represents the median RPKM values on each day for each subset. (D) Violin plot of the log2FC of 971 DEGs that were exclusively detected in PBMC within each cell subset.

