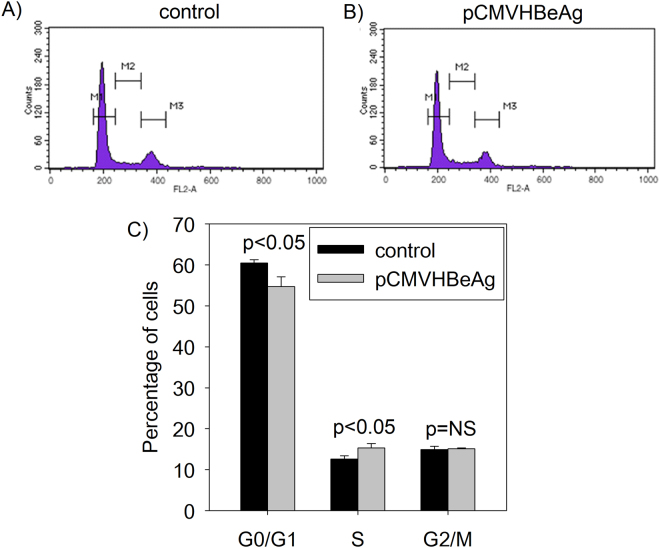
Figure 2.
Effect of HBeAg expression on cell cycle profile in Huh7 cells using flow cytometry. Huh7 cells transfected with the (A) control (no HBeAg) or (B) pCMVHBeAg were analysed by PI staining and flow cytometry (The M1 peak corresponds to cells in G0/G1, M3 peak corresponds to cells in G2/M and cells in S phase are shown as M2). (C) A bar graph showing the proportion of cells in different phases of cell cycle in the presence (pCMVHBeAg) and absence (control) of HBeAg as analysed by flow cytometry (the bar graphs are represented as mean ± SD with n = 3; NS = not significant).

