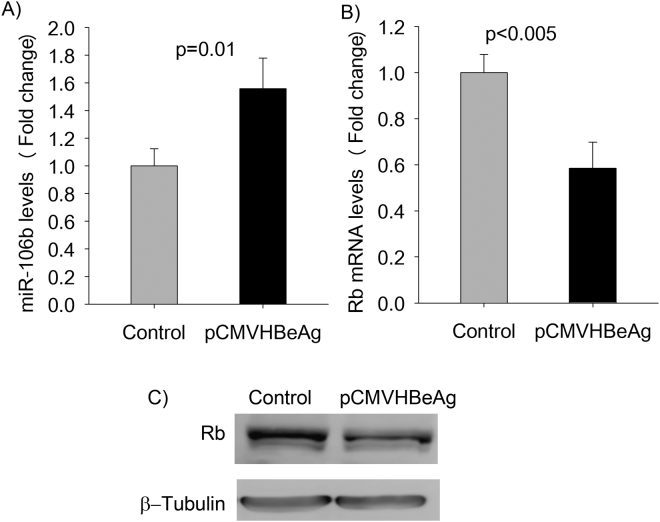
Figure 5.
Validation of microarray findings on miR-106b and the Rb gene. (A) Quantitation of miR-106b expression levels in cells transfected with pCMVHBeAg (expresses HBeAg) or the control (no HBeAg) using real time PCR. (B) Real time PCR quantitation of Rb mRNA levels (normalized using GAPDH levels) in cells expressing HBeAg (pCMVHBeAg) and in control cells (transfected with the control plasmid). (C) Western Blot analysis of pRb expression in Huh7 cells (The full-length western blots images are shown in supplementary Fig. S2; the bar graphs are represented as mean ± SD with n = 3).

