
Figure 3.
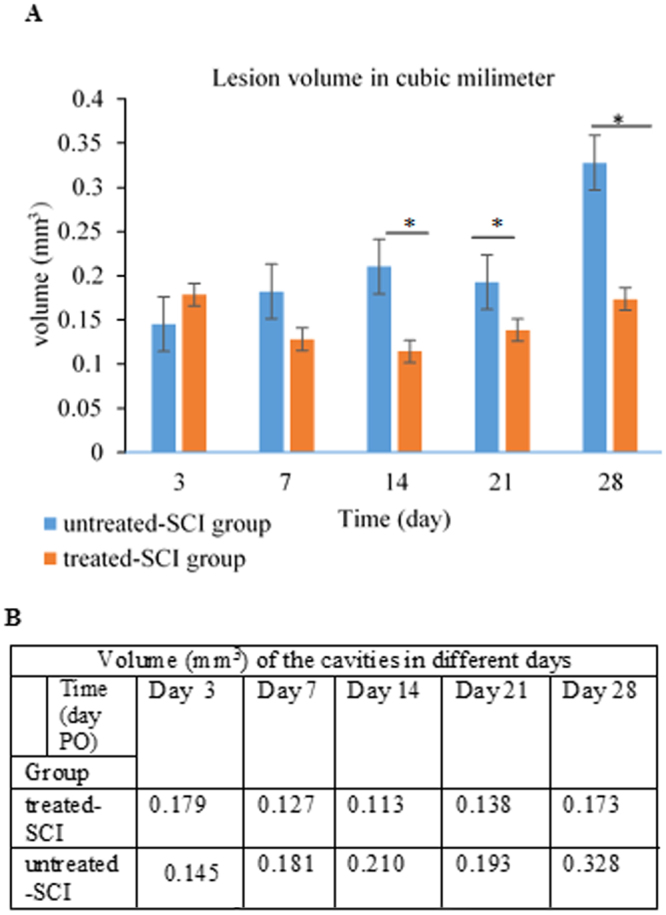
Reduced cavitation after palm vitamin E treatment. For measurements of the cavity volume, H and E sections were examined as detailed in material and methods. (A) Representative images of longitudinal sections of injured spinal cord 28 days after treatment. (B) Quantitative analysis of the cavity volumes on the basis of histological longitudinal images. The volume of the cavities in treated-SCI group decreased from day 3 to day 14 and then slightly increased within the rest days. In untreated-SCI group the volume of the cavity was slightly increased, then significantly increased in day 28. Data expressed as mean ± SD. *p < 0.05.