Fig. 6.
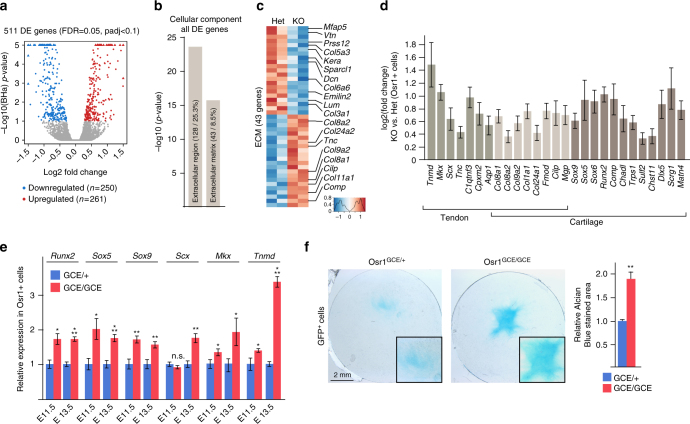
Osr1 controls ECM gene expression in a bimodal way and is required to prevent ectopic cartilage / tendon gene expression. a Volcano plot depiction of transcriptome analysis of FACS-sorted Osr1+ cells from limbs of E13.5 Osr1 GCE/+ or Osr1 GCE/GCE embryos shows differentially expressed (DE) genes between Osr1 GCE/+ and Osr1 GCE/GCE limb cells. 511 DE genes were identified with a false discovery rate of 0,05 that showed a log2 fold change over 1,2 or below 0,8 and a Benjamini-Hochberg adjusted p-value (padj) < 0,1. b GO analysis of all DE genes for “cellular component” showed enrichment for the indicated terms. c Heatmap depiction of all genes belonging to the term “extracellular matrix” (ECM). Selected ECM genes are indicated. d Bar graph plot for genes selected from all DE genes for their cartilage and/or tendon- specific expression pattern in embryo; note that all cartilage/tendon genes are upregulated in Osr1 mutants. e Confirmation of upregulation of Runx2, Sox5 and Sox9 (cartilage genes) and Scx, Mkx and Tnmd (tendon genes) in E11.5 and E13.5 Osr1 deficient cells by RT-qPCR (n = 4). f Chondrogenic culture of Osr1GCE/+ and Osr1GCE/GCE cells. Chondrogenic matrix is stained with Alcian blue, histomorphometric quantification is shown on the right. (n = 3). Error bars represent log2 fold change standard error (ifcSE) estimated by DESeq2 in d and s.e.m. in e, f. T-test: *=p < 0.05; **=p < 0.01; ***=p < 0.001. N-numbers indicate biological replicates, i.e. samples from different specimen

