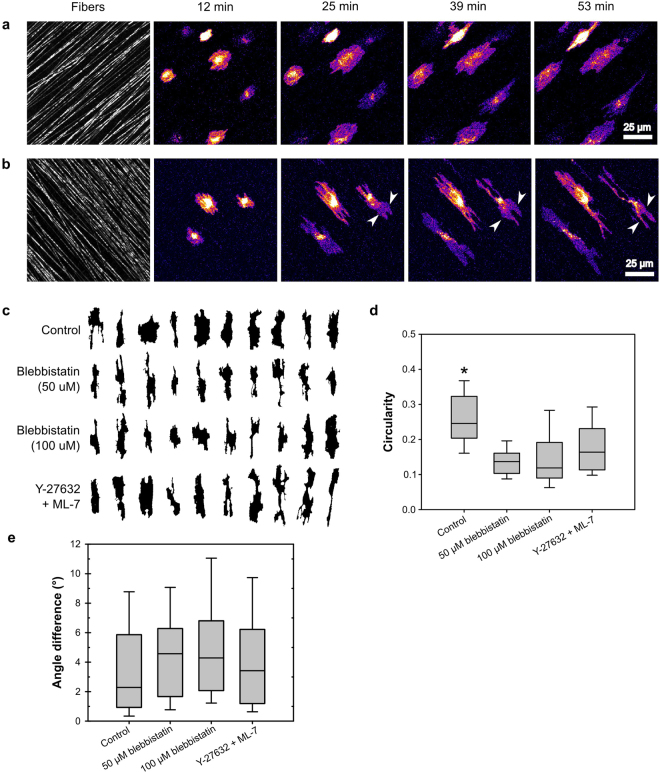
Figure 1.
HT-1080 cells orient to aligned fibers even under MII activity and organization inhibition. HT-1080 cells, stained with the membrane dye DiI were seeded on 2D PCL scaffolds with aligned fibers. (a and b) Selected frames from Supplementary Movies 1 and 2, respectively. Cells were imaged under control conditions (a) or treated with a combination of 20 µM Y-27632 and 10 µM ML-7 (b). Cells (DiI stain) are displayed using an intensity-based heatmap to better visualize them in spite of their large differences in brightness. The color of the heatmap has no physiological relevance. Under both control and inhibited conditions, cells protruded along the fibers, resulting in overall cell alignment to the fibers. Although protrusions perpendicular to the direction of fiber alignment did occur (often during spreading), the protrusions subsequently turned and proceeded along the fibers (e.g. arrowheads in B). Scale bar, 25 µm. (c–e) Images of multiple cells under control or inhibited conditions were acquired, 30 min after seeding: control, 53 cells from three experiments; 50 µM blebbistatin, 48 cells from two experiments; 100 µM blebbistatin, 44 cells from two experiments; Y-27632/ML-7, 33 cells from two experiments. (c) Representative silhouettes of cells illustrating their morphology and orientation under control conditions, treated with blebbistatin (50 and 100 μM), and treated with Y-27632/ML-7. All silhouettes have been rotated so that the substrate fibers (not depicted) in each image are aligned vertically. Cells and their individual protrusions remained aligned to fibers under all conditions. (d) Plot of the “circularity” morphological parameter. Center line of each box indicates the median; upper and lower bounds of the box indicate the 75th and 25th percentiles, respectively; the “whiskers” indicate the 10th and 90th percentiles. Inhibited cells had a significantly lower circularity than control cells (p < 0.01, Kruskal-Wallis test, Tukey-Kramer posthoc), indicating that they exhibited a higher number of protrusions22. (e) Plot of the difference in angle between cell orientation and the average direction of fiber alignment. All groups showed a median deviation of less than 5 degrees and a deviation of less than 11 degrees for at least 90% of their individuals.

