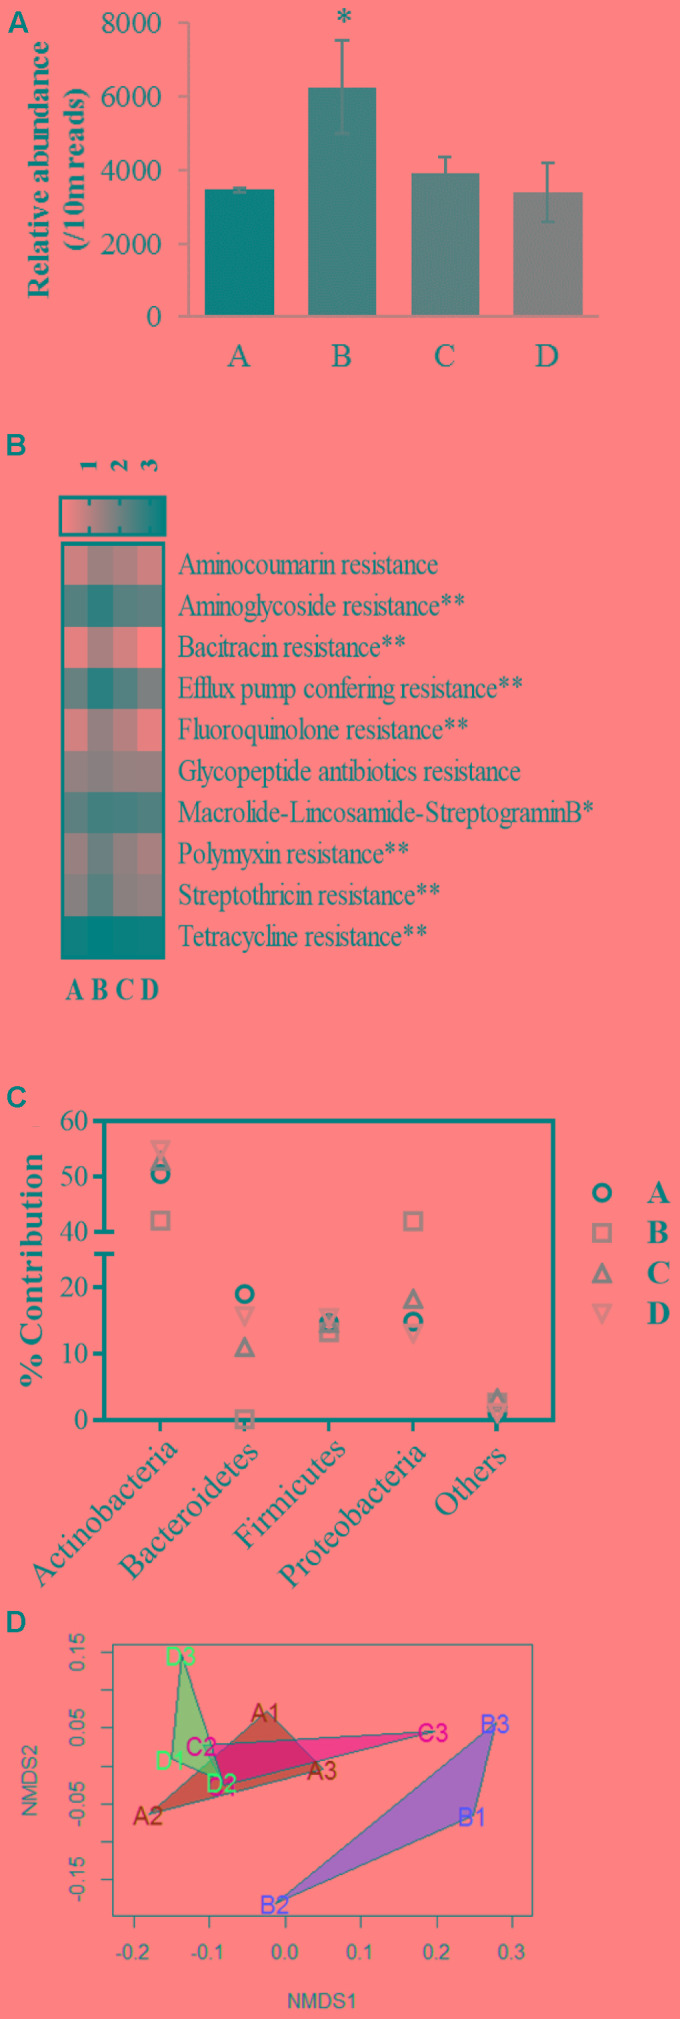
FIGURE 6.

Evaluation of resistome profiles in chicken gut microbiome. (A) Shows relative abundance (reads per 10 million sequences) of total Antibiotic Resistance Genes (ARGs) like reads observed in resistomes of broiler ceca from groups A, B, C, and D. (B) Exhibits a heatmap encompassing relative abundances of shared ARGs among the treatment groups in logarithmic scale where ∗∗ and ∗ indicates significant difference at alpha value of 0.10 and 0.15, respectively. (C) Depicts percent contribution of microbial taxa on relative abundances of ARGs in the core resistomes. (D) Shows non-metric multidimensional scaling (NMDS) plot of Bray-Curtis distances of the chicken cecal resistomes.
