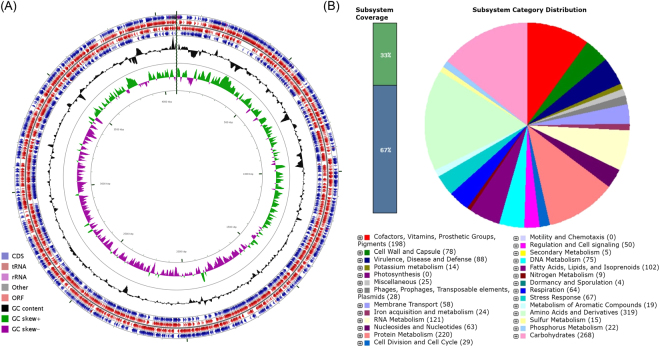
Figure 1.
Circular representation and subsystem category distribution of the genome of E. anophelis EM361-97. (A) Circles are numbered from 1 (the outermost circle) to 7 (the innermost circle). The outer four circles show the coding sequence (CDS), transfer ribonucleic acid (tRNA), ribosomal ribonucleic acid (rRNA), and open reading frame (ORF). The fifth circle represents the GC content (black). The sixth circle demonstrates the GC skew curve (positive GC skew, green; negative GC skew, violet). The genome position scaled in kb from base 1 is shown on the inner circle. (B) The genome of E. anophelis EM361-97 annotated using the Rapid Annotation System Technology (RAST) Server was classified into 356 subsystems and 27 categories. The green part in the bar chart at the leftmost position corresponds to the percentage of proteins included. The pie chart and the count of subsystem features in the right panel demonstrate the percentage distribution and category of the subsystems in E. anophelis EM361-97.

