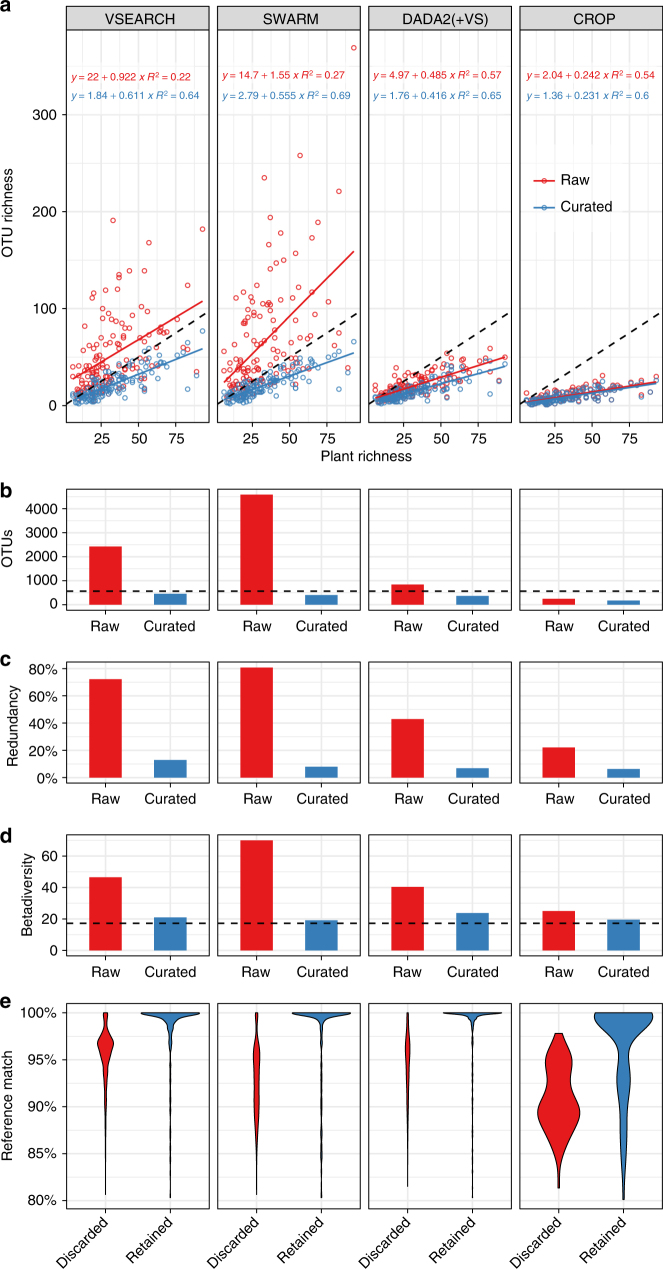
Fig. 1.
Effects of curation with the LULU algorithm for clustering methods at 97% level. OTU table metrics before (red = raw) and after (blue = curated) curation with LULU. a correspondence of OTU (plant ITS2 sequence data) richness vs. plant richness for each of the 130 sampling sites, b total number of OTUs compared to total plant species recorded (564 species, dashed line), c percentage of OTUs having taxonomically redundant annotation, d OTU β-diversity (total richness/mean site richness) compared to plant β-diversity (17.23, dashed line), e distribution of best reference database (GenBank) match for OTUs retained and discarded by LULU

