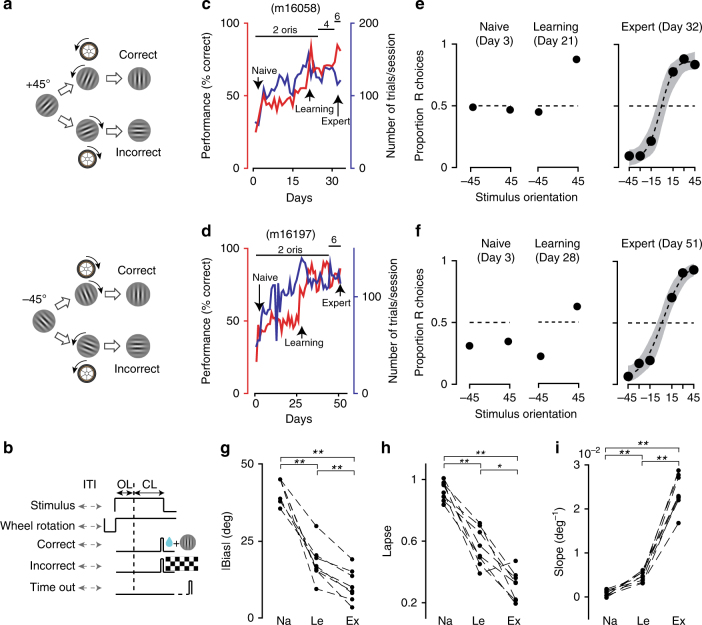
Fig. 3.
Two-alternative forced choice visual discrimination task. a Example trial: a sinusoidal static grating with +45° clockwise (top) or −45° counterclockwise (cc, bottom) orientation from vertical was presented on the screen. Mice had to indicate whether the orientation was clockwise or cc by rotating with the front paws a wheel position between them and the screen, with the wheel rotation controlling the real-time close-looped orientation of the visual stimulus. b Trial structure of reward and negative feedback; ITI inter trial interval (randomized), OL open-loop period, CL close-loop period. c Changes in performance and number of trials over training days for an example mouse (m16058), colors reflect the left–right y-axes. Top horizontal bars and numbers indicate changes in the number of orientations the animal had to discriminate: two orientations (±45, a), up to six orientations for a minimum deviation from vertical of ±15°. The number of orientations increased when performance reached ~70%. d Same as c for a different example mouse (m16197). e, f Psychometric curves during three different learning phases, naive, initial learning, expert, for m16058 (e) and m16197 (f). Shaded area in the expert curves represent 95% bootstrapped confidence interval. g–i Changes in bias, lapsing rate, and slope derived from psychometric functions (and from a linear model for two orientation conditions, Methods) during learning (n = 8 mice). Each dot is an average across the first 6 days of the corresponding learning phase (Na, Le, and Ex for naive, learning, and expert). P-values are calculated from two-tailed Wilcoxon signed rank tests, **P < 0.01, *P < 0.05

