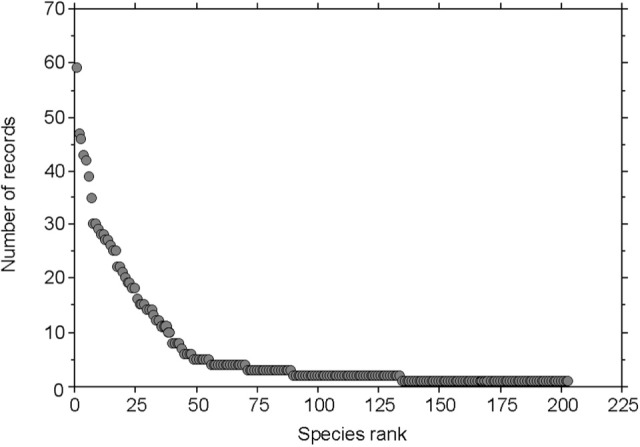
Figure 3.

Rank-abundance diagram of fungal taxa recorded by Favre (1955). The rank-abundance diagram displays the contribution of the fungal taxa (number of records) to a community against their ranks, with the most common species ranked first and the most rare species ranked last.
