Figure 3.
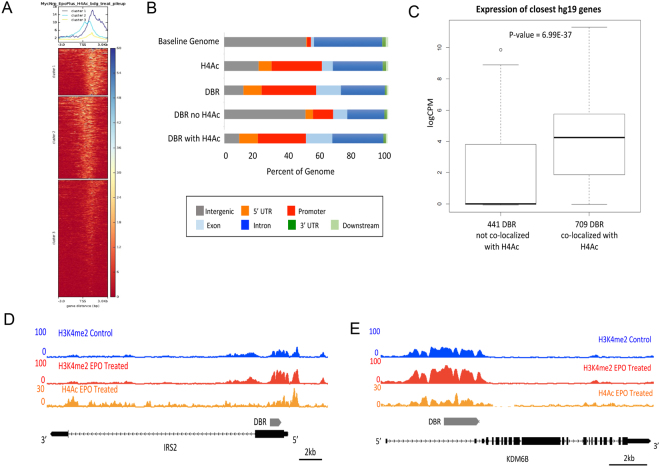
DBR co-localize extensively with regions of H4 Acetylation. (A) Heat map demonstrating the level of H4 Acetylation occupancy the 1150 DBR in EPO treated cells. (B) Relationship of DBR with and without co-localization of H4Ac to known genomic features. DBR that co-localize with H4Ac are located almost exclusively near protein coding genes, in stark contrast to DBR that do not localize with H4Ac, which are distributed more evenly throughout the genome. (C) Genes in close proximity (within 10 kb) of DBRs that co-localize with H4Ac are expressed at significantly higher levels than genes in close proximity of DBR that do not co-localize with H4Ac. (D) Example of H3K4me2 and H4Ac occupancy at the IRS2 locus. Grey bar represents DBR. (E) Example of H3K4me2 and H4Ac occupancy at the KDM6B locus. Grey bar represents DBR.

