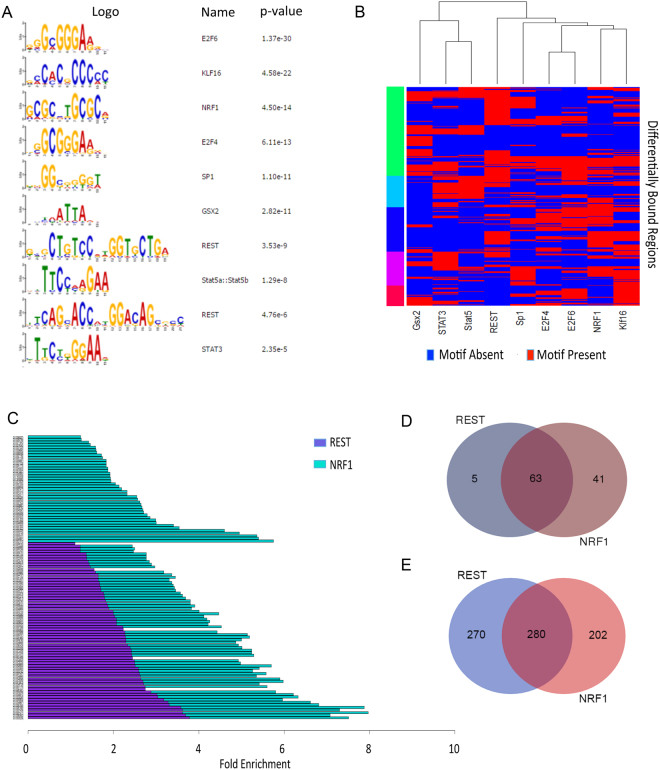
Figure 4.
An extensive network of transcriptional regulators underlies the DBR. (A) Meme-ChIP analyses identified several overrepresented motifs in the DBR. (B) Heat map depicting occupancy of significantly enriched motifs at the 1150 DBR. Factors whose motifs were significantly enriched in the DBR are listed on the x-axis and the DBR are on the Y-axis. Blue indicates a motif for a listed factor is absent in the DBR and Red indicates that the motif for a listed factor is present in that DBR. Many DBR contain motifs for more than one factor. (C) Gene set enrichment analyses of genes within 10 kb of a DBR containing rest motif (purple) or NRF1 motif (green) identified significant enrichment for multiple pathways. The graph demonstrates considerable overlap between pathways identified in association with REST- and NRF1- containing DBR. (D) Venn diagram representing the number of DBR that contain motifs for REST and/or NRF1. Many DBR contain motifs for both factors. (E) Venn diagram demonstrating the number of genes within 10 kb of DBR containing motifs for REST and/or NRF1.

