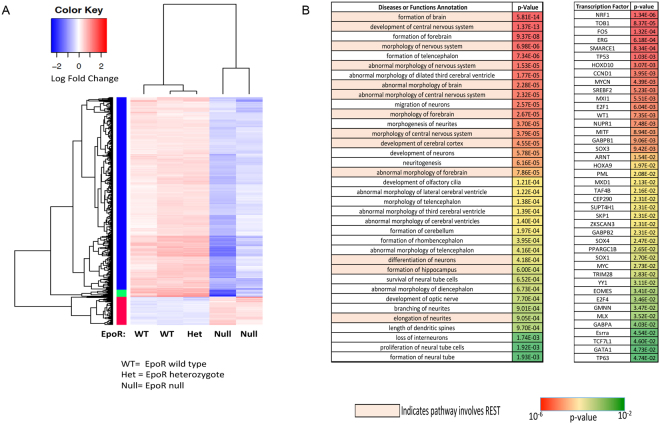
Figure 6.
Transcriptome analyses of EpoR-null and control cells. (A) Heat map of genes differentially expressed in neural tubes isolated from EpoR null and littermate control E9.0 embryos. (B) Left panel: Diseases or Functional Annotations identified through Ingenuity Pathway Analyses of differentially expressed genes. Pathways highlighted in orange include REST. Right panel: Transcription factors predicated to be upstream of genes differentially expressed between EpoR-null and littermate control neural tubes. NRF1 is the most significantly enriched transcription factor predicted to be upstream of the differentially expressed genes.

