

Abstract
Tall fescue (Festuca arundinacea Schreb) is a turf grass species which is widely used for rhizoremediation of organic contaminants and shows notable prospects in heavy metal phytoremediation. In this study, different concentrations of cadmium ion (Cd2+) were applied to study toxic effects of Cd2+ and responses of tall fescue by soilless culture. Tall fescue showed comparable high tolerance to Cd2+ as Indian mustard (Brassica juncea L.). Additionally, the treatment with high concentration of Cd2+ leaded to decreased chlorophyll contents, production of reactive oxygen species (ROS) and lipid peroxidation, as well as damage of cell membrane, necrosis and apoptosis in tall fescue roots, and toxicity of Cd2+ on physiologic properties of tall fescue has been well discussed. Moreover, in photosystem II electron donor side, electron transport from oxygen evolution complex (OEC) to Yz residue of D1 protein was inhibited under high Cd2+ treatments, which may be due to the Cd2+ induced ROS production and the replacement of Ca2+ in the core of OEC. In electron acceptor side, electron transport efficiency from quinone B to photosystem I acceptors increased under high Cd2+ treatments, which may be an important response for plants against Cd2+ toxicity and its mechanism needs our further study.
Introduction
Cadmium (Cd) is a dominant industrial and environmental pollutant in soils and it is widespread in environment especially in developing countries. It has deleterious effects on organisms within soils, associated vegetation cover as well as animals by food chain transport. In a certain concentration range, Cd shows greater toxicity to plants than the other heavy metals1. In plants, Cd could inhibit root growth, decrease chlorophyll content and photosynthesis, interfere with carbon metabolism, plant water status and nutrient uptake2. Through food chain and drinking water, it causes severe damage to a variety of organs including lung, liver, kidney, testis and placenta3.
Remover of Cd from soil environment has been an important issue. Phytoremediation is the use of plants to reduce concentrations or toxic effects of contaminants in the environments, and it is cost-effective, efficient, environmental friendly, and solar-driven technology with good public acceptance4. Early phytoremediation researches focused on hyperaccumulating plants because of their ability to concentrate high amounts of heavy metals in their tissues. However, hyperaccumulators often grow slowly and produce minimal biomass, and they generally only accumulate a specific toxic element from soil, which hinders their application in phytoremediation5. Tall fescue (Festuca arundinacea Schreb) is a major cool season forage and turf grass species grown in the temperate regions of the world. It was widely reported as a model species for rhizoremediation of organic contaminants due to its well-developed root system and broad adaptability to environment6. Early studies show that it has perfect resistance to heavy metal with high enrichment with various heavy metals including Cu, Cd, Pb, and Zn6–11, suggesting its remarkable prospects in phytoremediation.
The aim of this study was to evaluate toxicity of Cd in tall fescue roots and leaves and the response of tall fescue against Cd stress. To this purpose, 54 days old tall fescue were treated with different concentrations of cadmium ion (Cd2+) for two weeks, and Cd contents, leave lengths, chlorophyll contents, reactive oxygen species (ROS), malondialdehyde contents (MDA) were measured. Additionally, photosynthetic activities of the tall fescue leaves under Cd2+ stress or not were studied by fast chlorophyll fluorescence and slow chlorophyll fluorescence kinetic, and the results has been properly discussed.
Materials and Methods
Plant materials and Cd2+ treatment
A commercial type of tall fescue called “houndog 5” was seeded in plastic pots (7.5 cm in diameter and 8.5 cm deep) with gravel-perlite-peat (1:1:1, v/v/v) as medium. After germination, plants were kept in a greenhouse with a daily maximum/minimum temperature of 24/20 °C for 16 h photoperiod (300 µmol photons m−2s−1 PAR) allowing roots and shoots established12. The seedlings were watered daily, and fertilized twice a week with 1/2 Hoagland solution for 40 days. After that, the seedlings were transplanted to triangle bottles which were filled with 1/2 Hoagland solution, and cultivated for two weeks for acclamation. Cd2+ treatments were then carried out by addition of Cd2+ (CdCl2·4H2O, Sigma-Aldrich, St. Louis) to final concentrations of 0, 1, 5, 50, 150 mg/L Cd2+ for 2 weeks, and in this period culture medium was changed once every three days to maintain Cd2+ concentration.
Biomass and chlorophyll content
Length of tall fescue shoots were recorded by vernier caliper13. Chlorophyll contents of tall fescue leaves were measured using SPAD-502 (Minolta, Osaka, Japan) according to the protocol provided by the instrument, which is a non-destructive, accurate, rapid and convenient instrument to quickly determine content of chlorophyll14,15.
Cd2+ in tall fescue leaves and roots
Tall fescue roots and leaves were firstly washed with 10 mM EDTA for 3 times and 5 minutes for each time to remove Cd2+ adhered to their surface, then they were washed with deionized water and dried in oven at 60 °C to a constant weight. Then, dried leaves and roots were crushed by mortar and passed through a 100-mesh (0.15 mm) sieve. About 0.2 g of dried leaves and roots were put into digestion tanks with a mixture of HNO3 and H2O2 (4:1, v:v)16, then they were digested in a microwave digestion for 10 minutes. After suitable dilution with 1% HNO3, Cd2+ content in tall fescue leaves and roots were determined by flame atomic absorption analysis (AA-7001F, East & West Analytical Instrument). Cd2+ contents were expressed as mg g−l plant dry weight (DW).
Chlorophyll a fluorescence transient
In this study, all chlorophyll a fluorescence measurements were conducted by a PAM chlorophyll fluorometer (PAM 2500, Heinz Walz GmbH, Germany) with high time resolution (10 μs). For each test, measurements were repeated at least 4 times. After a dark-adaptation for 25 minutes, OJIP transients were induced by a red light of 3,000 photons μmol m−1s−1 provided by PAM 2500 through an array of light-emitting diodes. Chlorophyll a fluorescence emission induced by strong light pulses was then measured and digitized between 10 μs and 320 ms (Kautsky curve) and OJIP transients were analyzed using JIP-test as our previous study12.
Slow chlorophyll fluorescence kinetics
Slow chlorophyll fluorescence kinetic was also performed using PAM 2500 as reported by our previous research with minimum modification17. Briefly, after 25 min dark adaptation, minimal fluorescence value (Fo) was determined under far-red (FR) illumination (730 nm, 10 μmol photons m−2 s−1). Then a 0.8 s saturation pulse (3000 μmol photons m−2 s−1 PAR) was applied for recording of maximal fluorescence (F m). Subsequently, white actinic light (160 μmol photons m−2 s−1 PAR) was applied to induce photochemistry and reach steady-state condition. During the induction period, saturation pulses were applied during 30 s intervals to record light-adapted maximal fluorescence yield (F m′) to be used for quenching analysis. At the end of the induction period, immediately after switching off actinic light illumination, the minimal fluorescence at the light-adapted state (F o′) was recorded under FR illumination. Then relative parameters of slow chlorophyll fluorescence kinetics were read and recorded in the instrument.
Determination of ROS and activity of ascorbate peroxidase
Hydrogen peroxide (H2O2) contents and superoxide radical (O• 2 −) were measured by spectrophotometry as our previous research12. 3,3′-diamino-benzidine (DAB) (Sigma-Aldrich, St. Louis) and nitroblue tetrazolium (NBT) (Sigma-Aldrich, St. Louis) were used to stain H2O2 and O• 2 − respectively. Ascorbate peroxidase (APX) activitiy was determined by spectrophotometry, which uses H2O2 and ascorbate as substrate. Briefly, fresh leaves were ground in a mortar with liquid nitrogen, and homogenized in ice-cold sodium phosphate buffer (PBS, 50 mM, pH 7.8). The homogenate was centrifuged at 12,000 × g for 15 min at 4 °C, and supernatant was used as the crude extract for APX and protein content assay. Protein concentration was quantified by the Bradford method18, and APX activity was determined by APX test kit (Nanjing Jiancheng, China) according to the protocol provided by the manufacturer. The decrease in absorbance was recorded at 290 nm at an interval of 10 s up to 130 s. One unit APX activity was defined as in 1 mL reaction system catalysis 1 μmol ascorbate per minute per mg protein.
Detection of cell death by PI staining
To assess cell membrane integrity of tall fescue roots with Cd2+ treatments or not, roots were immersed in 1 mg/mL propidium iodide (PI, Sigma-Aldrich, St. Louis) dissolved in distilled water. After washing, root samples were examined with a confocal laser scanning microscope (Leica TCS SP8, Germany) using an excitation wavelength of 546 nm.
Lipid peroxidation
MDA content was determined by the method described by Hoeller19 with slight modification. In brief, fresh leaves were ground in a bowl chopper with liquid nitrogen, and then homogenized in ice-cold sodium phosphate buffer (50 mM, pH 7.8). The homogenate was then centrifuged at 12,000 g for 15 minutes at 4 °C. Then 1 mL enzyme solution was mixed with 2 mL of reaction solution containing 20% (v/v) trichloroacetic acid and 0.5% (v/v) thiobarbituric acid. The mixture was heated in a water bath at 100 °C for 30 minutes, then cooled to room temperature in ice-water bath and centrifuged at 10,000 × g for 10 minutes. Absorbance of the supernatant was measured at 532 and 600 nm. The content of MDA was calculated by subtracting the non-specific absorption at 600 nm from the absorption at 532 nm and calibrated using a extinction coefficient of 155 mM−1 cm−1. Lipid peroxidation was expressed as the MDA content in nmol per g fresh weight (FW).
Statistical Analysis
Each experiment was repeated at least four times. Values were given as means ± SD. Statistical analyses were performed by analysis of variance (ANOVA), and means were separated using Duncan’s multiple range tests at a significant level of P < 0.05.
Results
Cd2+ accumulation in tall fescue roots and leaves
Cd2+ contents in tall fescue leaves and roots after 2 weeks’ exposure to different concentrations of Cd2+ were shown in Table 1. From the table, the highest Cd2+ contents in tall fescue roots and leaves were observed in the 150 mg/L Cd2+ treatment, and there were 25.73 and 0.73 mg/g (DW) respectively. Additionally, Cd2+ contents of roots and leaves increased with the increase of Cd2+ treatment concentration. Additionally, translocation factors (TF) were calculated as the ratio of Cd2+ contents in leaves to Cd2+ contents in roots, and under 50 mg/L and 150 mg/L Cd2+ treatments the values of TF were lower than those under 1 and 5 mg/L Cd2+ treatments.
Table 1.
Cd2+ contents in tall fescue roots and leaves
| Cd2+ treatment (mg/L) | Cd2+ content (mg/g DW) | TF | |
|---|---|---|---|
| Roots | Leaves | ||
| 0 | nd | nd | nd |
| 1 | 0.54 ± 0.11 d | 0.026 ± 0.01 d | 0.0481 a |
| 5 | 1.57 ± 0.28 c | 0.08 ± 0.02 c | 0.0509 a |
| 50 | 5.78 ± 2.4 b | 0.18 ± 0.09 b | 0.0311 b |
| 150 | 25.73 ± 6.64 a | 0.73 ± 0.06 a | 0.0284 b |
*nd, none detected; TF (translocation factor) = Conleaves/Conroots; DW, dry weight; data are given as mean ± SD of four independent experiments, and different letters indicate statistical difference significance at P < 0.05 among the treatments by Duncan’s multiple range tests.
Effects of Cd2+ on growth and chlorophyll contents of tall fescue
After two weeks exposure to Cd2+, toxic effects of Cd2+ in tall fescue biomass and chlorophyll content were shown in Fig. 1. Tall fescue biomass decreased with the increase of Cd2+ treatment concentration. Additionally, there was no significant difference between the values of tall fescue biomass under 0 and 1 mg/L Cd2+ treatments, and 50 mg/L and 150 mg/L Cd2+ treatments significant lower tall fescue biomass. The values of tall fescue chlorophyll content showed similar trend with the study of biomass. The chlorophyll contents of 50 and 150 mg/L Cd2+ treatments were significantly lower than that of the control group.
Figure 1.
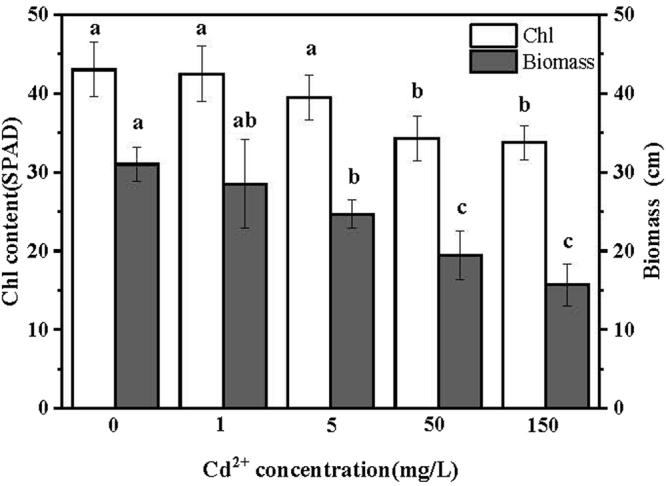
Effects of Cd2+ treatments on growth and chlorophyll contents of tall fescues. Values were given as means ± SD (n = 4). Means were separated using Duncan’s multiple range tests, and different letters indicates the significant difference at P < 0.05.
Effects of Cd2+ in ROS production of tall fescue leaves and APX activity
Production of ROS contents responded to Cd2+ treatments were studied by the histological staining method and shown in Fig. 2. The highest ROS contents in tall fescue leaves was observed in the 150 mg/L Cd2+ treatment. The concentration of H2O2 in this treatment was 76.5 mmol/g (FW) and the concentration of O2 •− in this treatment was 60.1 mmol/g (FW). Additionally, contents of H2O2 in tall fescue leaves increased significantly with the increase of Cd2+ treatment concentration, and in 1 mg/L Cd2+ treatment the H2O2 content increased about 30.7% than that of the control. Contents of O2 •− also increased with the increase of Cd2+ treatment concentration. However, there was no significant difference between the contents of O2 •– of tall fescue subjected to 0 and 1 mg/L Cd2+ treatments. Additionally, APX activity principally decreased with the increase of Cd2+ treatment concentration, and APX activity of 150 mg/L Cd2+ treated leaf was the smallest than the other treatments.
Figure 2.
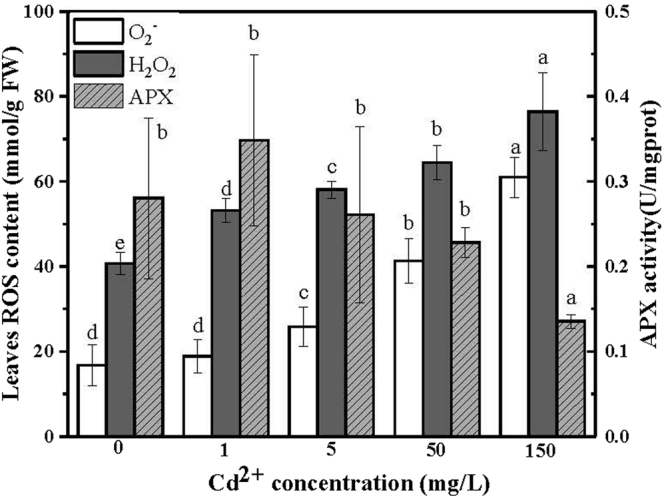
Effects of different Cd2+ treatments in ROS production and APX activity in tall fescue leaves. Values were given as means ± SD (n = 4). Means were separated using Duncan’s multiple range tests, and different letters indicate significant differences at P < 0.05.
Effects of Cd2+ treatments in membrane integrity of root cells and MDA contents of leaves and roots
Integrity of tall fescue root cells were studied by PI staining. Figure 3A and B showed PI staining figures of roots treated with 0 and 5 mg/L Cd2+, respectively. Arrow a and b indicated stained areas with the shape of round and square under the 5 mg/L Cd2+ treatment. In Fig. 3B we could find plenty of these kind of cells, while in Fig. 3A only three cells located on the margin of root were stained as this way. MDA contents of tall fescue leaves and roots after Cd2+ treatments were analyzed by spectrophotometry and shown in Fig. 3C. From the figure, MDA contents in roots treated with 5, 50 and 150 mg/L Cd2+ were higher than those treated with 0 and 1 mg/L Cd2+. Additionally, MDA contents in tall fescue leaves treated with Cd2+ were higher than that of the control, and MDA content of leaves treated with 150 mg/L Cd2+ was the highest.
Figure 3.

PI staining of tall fescue roots treated with 0 mg/L Cd2+ (A) and 5 mg/L Cd2+ (B), and effects of Cd2+ treatments on MDA contents of tall fescue roots and leaves (C). Values were given as means ± SD (n = 4), and means were separated using Duncan’s multiple range tests; different letters indicate significant difference at P < 0.05; bar = 75 μm.
Effect of Cd2+ stress on JIP-test of tall fescue leaves
As shown in Fig. 4, different Cd2+ treatments remarkably affect OJIP fluorescence transient curves of tall fescue leaves. Initial fluorescence of the OJIP curves increased with the increase of Cd2+ treatment concentration. Additionally, clear K-step of tall fescue leaves treated with 5, 50 and 150 mg/L Cd2+ were observed at 0.3 ms. To better understand toxic effect of Cd2+ on K step, K-band and L-band of the OJIP curves were studied and shown in Fig. 5. Figure 5A and B depict relative variable fluorescence between F 0 and F K (WOK) and differences of transients of Cd2+ treated samples (1, 5, 50, 150 mg/L Cd2+) minus control (0 mg/L Cd2+) (ΔWOK). In Fig. 5B, the sequence from upper to lower was tall fescue leaves treated with 150, 50, 5, 0 and 1 mg/L Cd2+.
Figure 4.
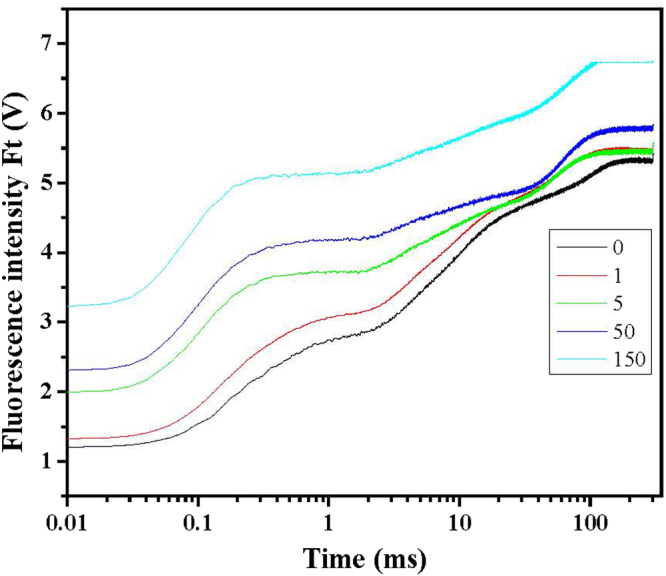
Effects of Cd2+ treatments on OJIP transient curves of tall fescue leaves. After a 25 min dark adaption period, the OJIP transients of tall fescue leaves were induced by a red light of 3000 μmol photons m−2 s−1 provided by PAM 2500 through an array of light-emitting diodes. Chlorophyll a fluorescence emissions were recorded by the instrument and most typical curves were shown here without normalization.
Figure 5.
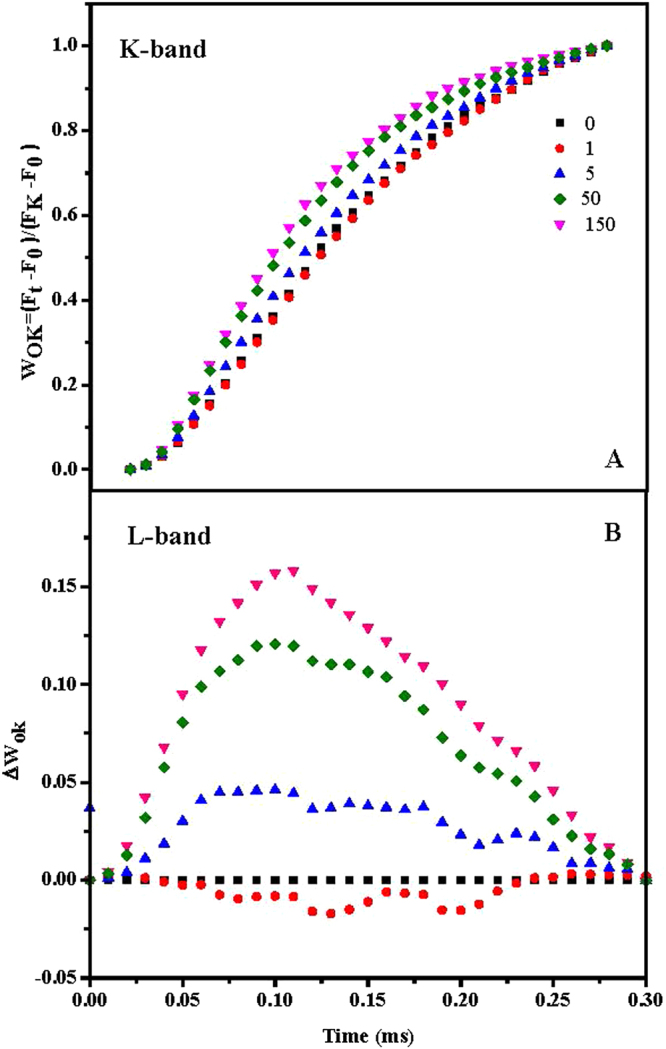
Effects of Cd2+ treatments on K-band and L-band of OJIP curves in tall fescue leaves. The difference of the Cd2+ treated samples to the control sample (0 mg/L Cd2+) (ΔVt), (A) between F 0 and F K: WOK = (F t − F 0)/(F K − F 0) and (B) the difference of the Cd2+ treated samples to the control sample (0 mg/L Cd2+) (ΔWOK).
The basic fluorescence parameters (Table 2) were extracted from the curves and subjected to the JIP-test. The JIP-test was used to further understand the energy flow and electron transport in PSII in this study, and the data of selected parameters and their definitions were shown in Table 3. Values of φP0 and ψE0 showed the same tendency that they were decreased with the increase of Cd2+ treatment concentration, while the values of φP0 of tall fescue treated with 150 mg/L Cd2+ was significantly lower than the other treatments and the values of ψE0 of tall fescue treated with 50 and 150 mg/L Cd2+ were significantly lower than the rest treatments. Meanwhile, the values of δR0 showed an opposite tendency that they were generally increased with the increase of Cd2+ treatment concentration, and the value of δR0 of 150 mg/L Cd2+ treatment was the highest. Additionally, values of PIABS and PItotal showed same tendency that they were decreased with the increase of Cd2+ treatment concentration, and values of PIABS and PItotal of the tall fescue treated with 150 mg/L Cd2+ were 62.7% and 39.5% smaller than that of the control, respectively.
Table 2.
Basic photosynthetic parameters extracted from OJIP transient curves
| Concentration (mg/L) | Photosynthetic parameters | ||||
|---|---|---|---|---|---|
| F 0 | F 300 | F J | F I | F M | |
| 0 | 1.32 ± 0.11 | 2.62 ± 0.24 | 3.11 ± 0.25 | 4.46 ± 0.31 | 5.31 ± 0.21 |
| 1 | 1.34 ± 0.35 | 2.58 ± 0.42 | 3.11 ± 0.32 | 4.41 ± 0.40 | 5.12 ± 0.29 |
| 5 | 1.47 ± 0.35 | 2.88 ± 0.51 | 3.40 ± 0.38 | 5.08 ± 0.25 | 5.67 ± 0.35 |
| 50 | 2.28 ± 0.69 | 4.0 ± 0.74 | 4.10 ± 0.52 | 5.19 ± 0.58 | 6.08 ± 0.37 |
| 150 | 3.10 ± 0.88 | 4.21 ± 1.10 | 4.11 ± 0.93 | 5.41 ± 0.67 | 6.76 ± 0.41 |
*F 0: fluorescence at 20 μs after the onset of actinic illumination; F 300: fluorescence value at 300 μs; F J: fluorescence value at the J-step (2 ms) of OJIP; F I: fluorescence value at the I-step (30 ms) of OJIP; F M: fluorescence value at the peak of the OJIP test; Values are given as the means ± SD (n = 5–7).
Table 3.
Photosynthetic parameters deduced by JIP-test of fluorescence transients.
| Photosynthetic parameters | Cd2+ treatment concentration | ||||
|---|---|---|---|---|---|
| 0 mg/L | 1 mg/L | 5 mg/L | 50 mg/L | 150 mg/L | |
| φP0 | 0.765 ± 0.01 a | 0.758 ± 0.01 a | 0.729 ± 0.02 a | 0.722 ± 0.06 a | 0.654 ± 0.05 b |
| ψE0 | 0.565 ± 0.04 a | 0.564 ± 0.02 a | 0.566 ± 0.03 a | 0.529 ± 0.02 bc | 0.504 ± 0.03 c |
| δR0 | 0.295 ± 0.03 c | 0.302 ± 0.03 bc | 0.340 ± 0.05 b | 0.314 ± 0.04 bc | 0.442 ± 0.05 a |
| ϒRC | 0.223 ± 0.02 a | 0.215 ± 0.02 a | 0.193 ± 0.03 b | 0.198 ± 0.02 ab | 0.164 ± 0.02 c |
| PIABS | 1.267 ± 0.38 a | 1.134 ± 0.22 a | 0.990 ± 0.31 ab | 0.824 ± 0.36 b | 0.473 ± 0.28 c |
| PItotal | 0.529 ± 0.07 a | 0.491 ± 0.09 a | 0.429 ± 0.07 a | 0.321 ± 0.05 b | 0.320 ± 0.07 b |
*φPo: maximum quantum yield for primary photochemistry, namely, FV/FM; ΨE0: efficiency/probability with which a PSII-trapped electron is transferred from QA to QB; δR0: efficiency/probability with which an electron from QB is transferred to PSI acceptors; ϒRC: probability that a PSII Chl molecule functions as RC; PIABS: PI (potential) for energy conservation from exciton to the reduction of intersystem electron; PItotal: PI (potential) for energy conservation from exciton to the reduction of PSI end acceptors. Subscript “0” indicates that the parameter refers to the onset of illumination. Values are given as the means ± SD (n = 5–7) and different letters indicate statistical difference significance at P < 0.05 among the treatments by Duncan’s multiple range tests.
Effect of Cd2+ stress on slow chlorophyll fluorescence kinetics
To further understand the behavior of PSII under Cd2+ stress or not, slow chlorophyll fluorescence kinetics were also studied. As shown in Table 4, 1 mg/L Cd2+ treatment significantly lower Y(II) (actual quantum yield of photochemical energy conversion in PS II), and Y(II) decreased with the increase of Cd2+ treatment concentration. Additionally, the values of Y(NPQ) (the quantum yield of regulated non-photochemical energy loss in PS II) increased with the increase of Cd2+ treatment concentration. However, there were no significant difference between the values of Y(NO)(quantum yield of non-regulated non-photochemical energy loss in PS II) of tall fescue treated with Cd2+ or not. Meanwhile, qP (coefficients estimating the fraction of open PS II reaction centers based on a puddle model) and qL (coefficients estimating the fraction of open PS II reaction centers based on a lake model) reflect fraction of open reaction center, and the difference is that qP is based on the puddle antenna model and qL is based on the lake antenna model20. In our study, both of them were decreased with the increase of Cd2+ treatment concentration. Moreover, the values of ETR (electron transfer rate) decreased with the increase of Cd2+ treatment concentration.
Table 4.
Photosynthetic parameters deduced by slow Chl fluorescence kinetics
| Photosynthetic parameters | Cd 2+ treatment concentration | ||||
|---|---|---|---|---|---|
| 0 mg/L | 1 mg/L | 5 mg/L | 50 mg/L | 150 mg/L | |
| Y(II) | 0.610 ± 0.02 a | 0.532 ± 0.03 b | 0.538 ± 0.04 b | 0.538 ± 0.03 b | 0.445 ± 0.02 c |
| Y(NPQ) | 0.103 ± 0.02 c | 0.184 ± 0.03 b | 0.184 ± 0.04 b | 0.185 ± 0.04 b | 0.263 ± 0.02 a |
| Y(NO) | 0.286 ± 0.01 a | 0.284 ± 0.08 a | 0.277 ± 0.01 a | 0.277 ± 0.01 a | 0.292 ± 0.01 a |
| NPQ | 0.360 ± 0.06 c | 0.647 ± 0.08 b | 0.668 ± 0.15 b | 0.672 ± 0.17 b | 0.905 ± 0.09 a |
| qN | 0.336 ± 0.04 c | 0.489 ± 0.04 b | 0.494 ± 0.06 b | 0.492 ± 0.07 b | 0.585 ± 0.02 a |
| qP | 0.863 ± 0.02 a | 0.794 ± 0.03 b | 0.802 ± 0.03 b | 0.796 ± 0.03 b | 0.697 ± 0.02 c |
| qL | 0.649 ± 0.03 a | 0.561 ± 0.03 b | 0.573 ± 0.04 b | 0.559 ± 0.03 b | 0.455 ± 0.03 c |
| ETR | 28.7 ± 1.0 a | 25.2 ± 1.5 b | 25.3 ± 1.8 b | 25.3 ± 1.6 b | 20.8 ± 0.8 c |
*Y(II), quantum yield of photochemical energy conversion in PS II; Y(NPQ), the quantum yield of regulated non-photochemical energy loss in PS II; Y(NO), quantum yield of non-regulated non-photochemical energy loss in PS II; NPQ, non-photochemical quenching parameter; qN, coefficients of non-photochemical quenching; qP, coefficients estimating the fraction of open PS II reaction centers based on a puddle model; qL, coefficients estimating the fraction of open PS II reaction centers based on a lake model; ETR, electron transfer rate (μmol electrons m−2 s−1). Values are given as the means ± SD (n = 5–7) and different letters indicate statistical difference significance at P < 0.05 among the treatments by Duncan’s multiple range tests.
Discussion
Photosynthates are the main source for biomass production21. Toxicity of Cd2+ significantly affect chlorophyll contents of tall fescue leaves and finally affect growth of tall fescue as shown in Fig. 1. In our study, compared to the control, 5 mg/L Cd2+ treatment for 14 days decreased the biomass of tall fescue for 20.4%, which exhibited comparable high Cd2+ tolerance than Indian mustard (Brassica juncea L.). Indian mustard is well known for its superior tolerance to Cd2+ toxicity22, and Vatehová reported that after 7 days treatment with 4.48 mg/L Cd2+ the shoots biomass of Indian mustard decreased about 25.6%23. There are some studies carried out with soilless medium and also concern the amount of Cd2+ absorbed by the tall fescue10,24,25. Due to the differences in the purpose of the study, we measured Cd2+ contents in roots with an EDTA wash step before digestion to exclude Cd2+ adsorbed on the surface of the roots. In this case, tall fescue still showed high absorbing ability, and in the 150 mg/L Cd2+ treatment, tall fescue absorbed 25.73 mg/g (DW) Cd2+ in their roots in 14 days.
In plants, Cd2+ could cause production of superoxide radicals and finally induce oxidative stress26. In this study, concentrations of H2O2 and O2 .− increased significantly with the increase of Cd2+ treatment concentration (Fig. 2). In plant cells, electron transport processes in chloroplasts and mitochondria are the potential source of ROS3, and plants develop their own regulation mechanism against oxidative stress, such as antioxidant relative enzyme27. However, presence of Cd2+ in plants could induce ROS formation28 by inhibition of ROS degradation enzyme (Fig. 2)29. In this case, the balance between ROS production and ROS scavenging mechanisms has been disturbed and lead to damage to proteins, lipids and carbohydrates30.
MDA is an oxidized product of membrane lipids and accumulates when plants are exposed to oxidative stresses10. Therefore, the concentration of MDA in plants is commonly considered as a general indicator of lipid peroxidation as well as oxidant stress level. Lipid peroxidation is closely relevant to ROS level, because H2O2 and O2 .− can initiate lipid peroxidation that results in formation of lipid hydroperoxide (LOOH)31,32. In this study, the MDA contents showed the tendency that they were increased with the increase of Cd2+ treatment concentration in both tall fescue roots and leaves. However, under the same treatment condition, the MDA contents in tall fescue leaves were generally lower than those in tall fescue roots, which may because tall fescue roots in this study were subjected to the toxicity of the Cd2+ directly and only few amounts of Cd2+ were transferred to leaves and lead to a relative lower damage to tall fescue leaves.
In this study, roots are primary contact site for Cd2+ in medium. Lower to 5 mg/L Cd2+ treatment induced significant difference of the MDA content in tall fescue roots between the control and Cd2+ treatments. Toxic effect of Cd2+ in tall fescue roots were further studied by PI staining method. PI could bind to pectin33 and DNA34 by intercalating between the bases, and it is used to stain cell wall as well as dead cells. A PI-positive nucleus is a strong indication of loss of membrane integrity due to its membrane-impermeable property, which is generally excluded from viable cells35. The arrow a and b in Fig. 3B indicate two typical PI staining cells with the shape of square and round. The round cells in the figure mean that they had lost membrane integrity, and the square cells mean the cell nuclei were disintegrated and cells were undergoing necrosis and apoptosis. Comparing to the control, a large number of cells in tall fescue roots treated with 5 mg/L Cd2+ lost their membrane integrity and underwent necrosis and apoptosis. The Cd2+ induced necrosis and apoptosis has been reported in plants36,37. In this study, Cd2+ induced ROS production may trigger the apoptosis of root cells, as a signaling event, and lead to cell necrosis as shown in Fig. 3 26,38,39.
The photosynthesis activities of tall fescue subjected to different Cd2+ treatments had been studied by fluorescence transient curves and shown in Fig. 4. From the figure, increased Cd2+ treatments increased initial fluorescence (F 0, equal to F 20 or F 50). After dark adaption, primary quinone acceptors in PSII are in oxidized state, and F 0 could be obtained by fluorescence emission from PSII induced by weak illumination. It refers to concepts of open, close and inactivation of reaction center (RC) in PSII40. In our study, the higher value of F 0 induced by Cd2+ treatment could be attribute to inactivation of RC. It has been reported that Cd2+ could exchange Mg2+ in Light Harvest Complex II (LHCII) and then disrupt its function41,42. Cd2+ exposure would result in disorganization of trimer-forming monomers of LHCII and lead to diminished LHCII aggregation complex43, and Lhcb1.1 isomers of LHCII was highly sensitive to Cd2+ stress44. Additionally, inactivation of RC is also proved by the study of ϒR. ϒR reflects probability that a PSII chlorophyll molecule functions as RC, and ϒRC in this study showed a tendency that they decreased with the increase of Cd2+ treatment concentration, and the value of ϒRC of 150 mg/L Cd2+ treatment was significant lower than the rest treatments (Table 3). Moreover, qP and qL decreased with the increase of Cd2+ treatment concentration (Table 4), which suggests that under Cd2+ stress, RC in tall fescue were partially closed.
Clear K-step of OJIP curves of tall fescue treated with 5, 50 and 150 mg/L Cd2+ were observed at 0.3 ms, which suggests that higher than 5 mg/L Cd2+ treatment could lead to inhibited electron transport from OEC to tyrosine residue (Yz, D1-Tyr161). Figure 5 explores K-band and L-band of OJIP curves of tall fescue treated with Cd2+ and gave more details about this step. From the figure, higher than 5 mg/L Cd2+ treatments increased amplitude of L-band, which is in accord with the finding about the appearance of the K-step at 0.3 ms. Inhibited electron transport from OEC to Yz may attribute to, firstly, damage of D1 protein induced by ROS. PsbA encoded D1 protein accepts electron from OEC and toxic nature of the water-oxidation reaction defines the property of rapid turnover of D1 protein. Highly reactive O2 .− produced in water-oxidation reaction is extremely destructive to D1 protein45, and Cd2+ induced ROS production (Fig. 2) may enhance susceptibility of this protein. Secondly, Cd2+ could replace Ca2+ in OEC with high affinity and inhibit activity of OEC. A high-resolution structural analysis reveals that OEC contains five oxygen in addition to four Mn and one Ca atoms, forming a Mn4CaO5-cluster46. It has been reported that Cd2+ could competitively bind to essential site belong to Ca2+ and lead to inhibition of photosynthetic oxygen evolution, and finally inhibited electron transport from OEC to Yz47–49.
OJIP transient data were analyzed using JIP-test as our previous research12, which was developed by Strasser and based on the theory of energy fluxes in bio-membranes40,50,51. Electron transport in photosystem was divided to three major steps, namely, trapping of photon, electron transport after quinone A (QA −) to intersystem electron acceptors and reduction of end acceptors52. φPo depicts efficiency of trapping photon which mainly refers to electron donor side in PSII. In our study, the treatments with high content of Cd2+ significantly lower the values of φPo, which is in accord with the finding we have discussed above. In electron donor side, electron transport efficiency from OEC to Yz were inhibited by Cd2+, which may be due to the increase of ROS contents and the replacement of Ca2+ located in the core of OEC. Additionally, we found that δR0 principally increased with the increase of Cd2+ treatment concentration. It means that electron transport efficiency from quinone B (QB) to the PSI acceptors increased under high Cd2+ treatments, which may be an important response for plants against Cd2+ toxicity. It has been reported that antenna proteins of PSI and Light Harvest Complex 1 (LHC1) reduced significantly in Spinacia oleracea L. under Cd2+ stress44. However, it is still not clear how reduced antenna proteins and LHC1 affect electron transport efficiency from QB to the PSI acceptors. Although we could not find relative research about effect of Cd2+ in electron transport from QB to PSI electron acceptor, Schottler reported that mobile carrier plastocyanin (PC) exhibited a nearly linear relationship with PSI flux rate. This finding suggests that PC may play an important role in the response of PSI against Cd2+ toxicity and it needs our further study.
Additionally, in this study both PIABS and PITotal decreased with the increase of Cd2+ treatment concentration, which is in accord with the result obtained by slow fluorescence kinetics study (Table 4), which showed that ETR decreased with the increase of Cd2+ treatment concentration. Additionally, it is also in accord with the result reported by Zurk53. That could principally be attributed to inhibited activities in the electron donor side. Although the electron transport efficiency from QB to the PSI acceptors increased with the increase of the Cd2+ treatment concentration, electrons arrived to QB still only take a small portion compared to electrons absorbed by PSII antenna pigments.
The effect of Cd2+ on the mode of the yields for dissipative processes for energy absorbed by tall fescue PS II were studied and shown in Table 4. In any case, the sum of Y(II), Y(NPQ) and Y(NO) is unity. In Table 4, significant difference between Y(II) of tall fescue treated with 0 and 1 mg/L Cd2+ is obtained, and it proves that this parameter is more sensitive than φPo. which suggest that it could be a better stress indicator than φPo, even the measurement of slow kinetics is much more time costly. Additionally, Y(NPQ) increased with the decrease of Y(II), and there was no significant difference between the values of Y(NO) of tall fescue treated with Cd2+ or not. This result suggests that under Cd2+ stress more absorbed energy flux was dissipated via regulated non-photochemical quenching in PSII to avoid overreduction of electron transport chain in plants under stress condition17, which represents an important photoprotective mechanism in plants54.
Conclusion
In this study, toxic effects of Cd2+ in tall fescue and the response of tall fescue against Cd2+ toxicity were studied. Tall fescue exhibited high tolerance and bioconcentration to Cd2+. High content of Cd2+ leaded to decreased biomass and chlorophyll contents, production of ROS and lipid peroxidation, as well as necrosis and apoptosis in tall fescue roots. Additionally, in PSII the electron transport from OEC to Yz residue in D1 protein was inhibited under high Cd2+ treatments, which may be due to the Cd2+ induced ROS production and the replacement of Ca2+ in the core of OEC. The electron transport efficiency from QB to PSI acceptors increased under high Cd2+ treatments, which may be an important response of tall fescue against Cd2+ toxicity and needs our further study.
Acknowledgements
This work was financially supported by the National Natural Science Foundation of China (41503067, 21477165 and 21503283), the National Sci-Tech Support Plan (2015BAB01B04), the Fundamental Research Funds for the Central Universities (CZQ15010) and South-Central University for Nationalities Innovation Foundation for Postgraduate.
Author Contributions
M.H., K.C. wrote the main manuscript text, and J.Z. and D.T. prepared figures, and H.Z., X.H. and L.C. prepared the tables, D.D., J.Y. and S.J. designed the overall of this study. All authors reviewed the manuscript.
Competing Interests
The authors declare that they have no competing interests.
Footnotes
Publisher's note: Springer Nature remains neutral with regard to jurisdictional claims in published maps and institutional affiliations.
Contributor Information
Ke Chen, Email: kechen@mail.scuec.edu.cn.
Jie Sun, Email: jetsun@mail.scuec.edu.cn.
References
- 1.Zhao S, Shang X, Duo L. Accumulation and spatial distribution of Cd, Cr, and Pb in mulberry from municipal solid waste compost following application of EDTA and (NH4)(2)SO4. Environ. Sci. Pollut. R. 2013;20:967–975. doi: 10.1007/s11356-012-0992-z. [DOI] [PubMed] [Google Scholar]
- 2.Nagajyoti PC, Lee KD, Sreekanth TVM. Heavy metals, occurrence and toxicity for plants: a review. Environ. Chem. Lett. 2010;8:199–216. doi: 10.1007/s10311-010-0297-8. [DOI] [Google Scholar]
- 3.Harris NS, Taylor GJ. Cadmium uptake and translocation in seedlings of near isogenic lines of durum wheat that differ in grain cadmium accumulation. Bmc. Plant Biol. 2004;4:4–4. doi: 10.1186/1471-2229-4-4. [DOI] [PMC free article] [PubMed] [Google Scholar]
- 4.Doncheva S, et al. Plant response to lead in the presence or absence EDTA in two sunflower genotypes (cultivated H. annuus cv. 1114 and interspecific line H. annuus x H. argophyllus) Environ. Sci. Pollut. R. 2013;20:823–833. doi: 10.1007/s11356-012-1274-5. [DOI] [PubMed] [Google Scholar]
- 5.He J, et al. Overexpression of bacterial gamma-glutamylcysteine synthetase mediates changes in cadmium influx, allocation and detoxification in poplar. New Phytol. 2015;205:240–254. doi: 10.1111/nph.13013. [DOI] [PubMed] [Google Scholar]
- 6.Lu M, Zhang Z-Z. Phytoremediation of soil co-contaminated with heavy metals and deca-BDE by co-planting of Sedum alfredii with tall fescue associated with. Bacillus cereus JP12. Plant Soil. 2014;382:89–102. doi: 10.1007/s11104-014-2147-0. [DOI] [Google Scholar]
- 7.Begonia MT, Begonia GB, Ighoavodha M, Gilliard D. Lead accumulation by tall fescue (Festuca arundinacea Schreb.) grown on a lead-contaminated soil. Inter. J Env. Res. Pub. Heal. 2005;2:228–233. doi: 10.3390/ijerph2005020005. [DOI] [PMC free article] [PubMed] [Google Scholar]
- 8.Batty LC, Anslow M. Effect of a polycyclic aromatic hydrocarbon on the phytoremediation of zinc by two plant species (Brassica juncea and Festuca arundinacea) Int. J Phytoremediat. 2008;10:236–251. doi: 10.1080/15226510801997549. [DOI] [PubMed] [Google Scholar]
- 9.Ren, A. Z., Li, C. & Gao, Y. B. Endophytic fungus improves growth and metal uptake of Lolium Arundinaceum Darbyshire ex. Schreb. Int. J Phytoremediat. 13, 233–243, Pii 92713415510.1080/15226511003671387 (2011). [DOI] [PubMed]
- 10.Soleimani M, et al. Effect of endophytic fungi on cadmium tolerance and bioaccumulation by Festuca Arundinacea and Festuca Pratensis. Int. J Phytoremediat. 2010;12:535–549. doi: 10.1080/15226510903353187. [DOI] [PubMed] [Google Scholar]
- 11.Palazzo, A. J., Cary, T. J., Hardy, S. E. & Lee, C. R. Root growth and metal uptake in four grasses grown on zinc-contaminated soils. J Environ. Qual. 32, 834–840, doi:10.2134/jeq. 2003.8340 (2003). [DOI] [PubMed]
- 12.Chen K, Chen L, Fan J, Fu J. Alleviation of heat damage to photosystem II by nitric oxide in tall fescue. Photosynth. Res. 2013;116:21–31. doi: 10.1007/s11120-013-9883-5. [DOI] [PubMed] [Google Scholar]
- 13.Zhang X, Fan X, Li C, Nan Z. Effects of cadmium stress on seed germination, seedling growth and antioxidative enzymes in Achnatherum inebrians plants infected with a Neotyphodium endophyte. Plant Growth Regul. 2010;60:91–97. doi: 10.1007/s10725-009-9422-8. [DOI] [Google Scholar]
- 14.Wang L, et al. Overexpression of tomato GDP-L-galactose phosphorylase gene in tobacco improves tolerance to chilling stress. Plant Cell Rep. 2014;33:1441–1451. doi: 10.1007/s00299-014-1627-2. [DOI] [PubMed] [Google Scholar]
- 15.Uddling J, Gelang-Alfredsson J, Piikki K, Pleijel H. Evaluating the relationship between leaf chlorophyll concentration and SPAD-502 chlorophyll meter readings. Photosynth. Res. 2007;91:37–46. doi: 10.1007/s11120-006-9077-5. [DOI] [PubMed] [Google Scholar]
- 16.Uraguchi S, et al. Root-to-shoot Cd translocation via the xylem is the major process determining shoot and grain cadmium accumulation in rice. J Exp. Bot. 2009;60:2677–2688. doi: 10.1093/jxb/erp119. [DOI] [PMC free article] [PubMed] [Google Scholar]
- 17.Chen K, et al. High correlation between thermotolerance and photosystem II activity in tall fescue. Photosynth. Res. 2014;122:305–314. doi: 10.1007/s11120-014-0035-3. [DOI] [PubMed] [Google Scholar]
- 18.Bradford MM. A rapid and sensitive method for the quantitation of microgram quantities of protein utilizing the principle of protein-dye binding. Anal. Biochem. 1976;72:248–254. doi: 10.1016/0003-2697(76)90527-3. [DOI] [PubMed] [Google Scholar]
- 19.Hoeller S, et al. Ascorbate biosynthesis and its involvement in stress tolerance and plant development in rice (Oryza sativa L.) Plant Mol. Biol. 2015;88:545–560. doi: 10.1007/s11103-015-0341-y. [DOI] [PubMed] [Google Scholar]
- 20.Kramer DM, Johnson G, Kiirats O, Edwards GE. New fluorescence parameters for the determination of Q(A) redox state and excitation energy fluxes. Photosynth. Res. 2004;79:209–218. doi: 10.1023/B:PRES.0000015391.99477.0d. [DOI] [PubMed] [Google Scholar]
- 21.Hogberg P, et al. Large-scale forest girdling shows that current photosynthesis drives soil respiration. Nature. 2001;411:789–792. doi: 10.1038/35081058. [DOI] [PubMed] [Google Scholar]
- 22.Ahmad P, et al. Alleviation of cadmium toxicity in Brassica Juncea l. (Czern. & Coss.) by calcium application involves various physiological and biochemical strategies. Plos One. 2015;10:17. doi: 10.1371/journal.pone.0114571. [DOI] [PMC free article] [PubMed] [Google Scholar]
- 23.Vatehova Z, et al. Interaction of silicon and cadmium in Brassica juncea and Brassica napus. Biologia. 2012;67:498–504. doi: 10.2478/s11756-012-0034-9. [DOI] [Google Scholar]
- 24.Xu PX, Wang ZL. Physiological mechanism of hypertolerance of cadmium in Kentucky bluegrass and tall fescue: chemical forms and tissue distribution. Environ. Exp. Bot. 2013;96:35–42. doi: 10.1016/j.envexpbot.2013.09.001. [DOI] [Google Scholar]
- 25.Lou, Y. H. et al. Germination, physiological responses and gene expression of tall fescue (Festuca arundinacea Schreb.) growing under Pb and Cd. Plos One12, ARTN e016949510.1371/journal.pone.0169495 (2017). [DOI] [PMC free article] [PubMed]
- 26.Neill S, Desikan R, Hancock J. Hydrogen peroxide signalling. Curr. Opin. Plant Biol. 2002;5:388–395. doi: 10.1016/S1369-5266(02)00282-0. [DOI] [PubMed] [Google Scholar]
- 27.Rodriguez-Serrano M, et al. Cadmium effect on oxidative metabolism of pea (Pisum sativum L.) roots. Imaging of reactive oxygen species and nitric oxide accumulation in vivo. Plant Cell Environ. 2006;29:1532–1544. doi: 10.1111/j.1365-3040.2006.01531.x. [DOI] [PubMed] [Google Scholar]
- 28.Zhang F, Zhang H, Wang G, Xu L, Shen Z. Cadmium-induced accumulation of hydrogen peroxide in the leaf apoplast of Phaseolus aureus and Vicia sativa and the roles of different antioxidant enzymes. J Hazard.Mater. 2009;168:76–84. doi: 10.1016/j.jhazmat.2009.02.002. [DOI] [PubMed] [Google Scholar]
- 29.Schutzendubel A, et al. Cadmium-induced changes in antioxidative systems, hydrogen peroxide content, and differentiation in Scots pine roots. Plant Physiol. 2001;127:887–898. doi: 10.1104/pp.010318. [DOI] [PMC free article] [PubMed] [Google Scholar]
- 30.Gill SS, Tuteja N. Reactive oxygen species and antioxidant machinery in abiotic stress tolerance in crop plants. Plant Physiol. Bioch. 2010;48:909–930. doi: 10.1016/j.plaphy.2010.08.016. [DOI] [PubMed] [Google Scholar]
- 31.Kangasjarvi J, Jaspers P, Kollist H. Signalling and cell death in ozone-exposed plants. Plant Cell Environ. 2005;28:1021–1036. doi: 10.1111/j.1365-3040.2005.01325.x. [DOI] [Google Scholar]
- 32.Xu YF, Sun XL, Jin JW, Zhou H. Protective effect of nitric oxide on light-induced oxidative damage in leaves of tall fescue. J Plant Physiol. 2010;167:512–518. doi: 10.1016/j.jplph.2009.10.010. [DOI] [PubMed] [Google Scholar]
- 33.Rounds CM, Lubeck E, Hepler PK, Winship LJ. Propidium iodide competes with Ca2+ to label pectin in pollen tubes and arabidopsis root hairs. Plant Physiol. 2011;157:175–187. doi: 10.1104/pp.111.182196. [DOI] [PMC free article] [PubMed] [Google Scholar]
- 34.Nicotera, P., Leist, M. & Ferrando-May, E. In Biochem Soc Symp Vol. 66 Biochemical Society Symposia (eds G. C. Brown, D. G. Nicholls, & C. E. Cooper) 69–73 (Portland Press Ltd, 1999). [DOI] [PubMed]
- 35.Ma W, et al. Nitric oxide modulates cadmium influx during cadmium-induced programmed cell death in tobacco BY-2 cells. Planta. 2010;232:325–335. doi: 10.1007/s00425-010-1177-y. [DOI] [PubMed] [Google Scholar]
- 36.Fojtova M, Kovarik A. Genotoxic effect of cadmium is associated with apoptotic changes in tobacco cells. Plant Cell Environ. 2000;23:531–537. doi: 10.1046/j.1365-3040.2000.00573.x. [DOI] [Google Scholar]
- 37.Behboodi BS, Samadi L. Detection of apoptotic bodies and oligonucleosomal DNA fragments in cadmium-treated root apical cells of Allium cepa Linnaeus. Plant Sci. 2004;167:411–416. doi: 10.1016/j.plantsci.2004.04.024. [DOI] [Google Scholar]
- 38.Beers EP, McDowell JM. Regulation and execution of programmed cell death in response to pathogens, stress and developmental cues. Curr. Opin. Plant Biol. 2001;4:561–567. doi: 10.1016/S1369-5266(00)00216-8. [DOI] [PubMed] [Google Scholar]
- 39.Delledonne, M., Zeier, J., Marocco, A. & Lamb, C. Signal interactions between nitric oxide and reactive oxygen intermediates in the plant hypersensitive disease resistance response. P Natl. Acad. Sci. USA98, 13454–13459, 10.1073/pnas.231178298 (2001). [DOI] [PMC free article] [PubMed]
- 40.Tsimilli-Michael, M. & Strasser, R. In Photosynthesis. Energy from the Sun (eds JohnF Allen, Elisabeth Gantt, JohnH Golbeck, & Barry Osmond) Ch. 156, 697–702 (Springer Netherlands, 2008).
- 41.Kuepper H, Kuepper F, Spiller M. Environmental relevance of heavy metal-substituted chlorophylls using the example of water plants. J Exp. Bot. 1996;47:259–266. doi: 10.1093/jxb/47.2.259. [DOI] [Google Scholar]
- 42.Kupper H, Kupper FC, Spiller M. In situ detection of heavy metal substituted chlorophylls in water plants. Photosynth. Res. 1998;58:123–133. doi: 10.1023/A:1006132608181. [DOI] [Google Scholar]
- 43.Janik E, Maksymiec W, Mazur R, Garstka M, Gruszecki WI. Structural and functional modifications of the major Light-Harvesting Complex II in cadmium- or copper-treated Secale cereale. Plant Cell Physiol. 2010;51:1330–1340. doi: 10.1093/pcp/pcq093. [DOI] [PubMed] [Google Scholar]
- 44.Fagioni M, Damici GM, Timperio AM, Zolla L. Proteomic analysis of multiprotein complexes in the thylakoid membrane upon cadmium treatment. J Proteome. Res. 2009;8:310–326. doi: 10.1021/pr800507x. [DOI] [PubMed] [Google Scholar]
- 45.Barber J, Andersson B. Too much of a good thing: light can be bad for photosynthesis. Trends Biochem. Sci. 1992;17:61–66. doi: 10.1016/0968-0004(92)90503-2. [DOI] [PubMed] [Google Scholar]
- 46.Umena Y, Kawakami K, Shen J-R, Kamiya N. Crystal structure of oxygen-evolving photosystem II at a resolution of 1.9 angstrom. Nature. 2011;473:55–U65. doi: 10.1038/nature09913. [DOI] [PubMed] [Google Scholar]
- 47.Toth T, Zsiros O, Kis M, Garab G, Kovacs L. Cadmium exerts its toxic effects on photosynthesis via a cascade mechanism in the cyanobacterium. Synechocystis PCC 6803. Plant Cell Environ. 2012;35:2075–2086. doi: 10.1111/j.1365-3040.2012.02537.x. [DOI] [PubMed] [Google Scholar]
- 48.Sigfridsson KGV, Bernat G, Mamedov F, Styring S. Molecular interference of Cd2+ with Photosystem II. BBA-Bioenergetics. 2004;1659:19–31. doi: 10.1016/j.bbabio.2004.07.003. [DOI] [PubMed] [Google Scholar]
- 49.Faller P, Kienzler K, Krieger-Liszkay A. Mechanism of Cd2+ toxicity: Cd2+ inhibits photoactivation of Photosystem II by competitive binding to the essential Ca2+ site. BBA-Bioenergetics. 2005;1706:158–164. doi: 10.1016/j.bbabio.2004.10.005. [DOI] [PubMed] [Google Scholar]
- 50.Rai MK, Shende S, Strasser RJ. JIP test for fast fluorescence transients as a rapid and sensitive technique in assessing the effectiveness of arbuscular mycorrhizal fungi in zea mays: Analysis of chlorophyll a fluorescence. Plant Biosyst. 2008;142:191–198. doi: 10.1080/11263500802150225. [DOI] [Google Scholar]
- 51.Toth SZ, Schansker G, Garab G, Strasser RJ. Photosynthetic electron transport activity in heat-treated barley leaves: The role of internal alternative electron donors to photosystem II. BBA-Bioenergetics. 2007;1767:295–305. doi: 10.1016/j.bbabio.2007.02.019. [DOI] [PubMed] [Google Scholar]
- 52.Stirbet A. & Govindjee. On the relation between the Kautsky effect (chlorophyll a fluorescence induction) and Photosystem II: Basics and applications of the OJIP fluorescence transient. J Photoch. Photobio. B. 2011;104:236–257. doi: 10.1016/j.jphotobiol.2010.12.010. [DOI] [PubMed] [Google Scholar]
- 53.Zurek G, Rybka K, Pogrzeba M, Krzyzak J, Prokopiuk K. Chlorophyll a fluorescence in evaluation of the effect of heavy metal soil contamination on perennial grasses. Plos one. 2014;9:e91475–e91475. doi: 10.1371/journal.pone.0091475. [DOI] [PMC free article] [PubMed] [Google Scholar]
- 54.Nilkens M, et al. Identification of a slowly inducible zeaxanthin-dependent component of non-photochemical quenching of chlorophyll fluorescence generated under steady-state conditions in Arabidopsis. BBA-Bioenergetics. 2010;1797:466–475. doi: 10.1016/j.bbabio.2010.01.001. [DOI] [PubMed] [Google Scholar]