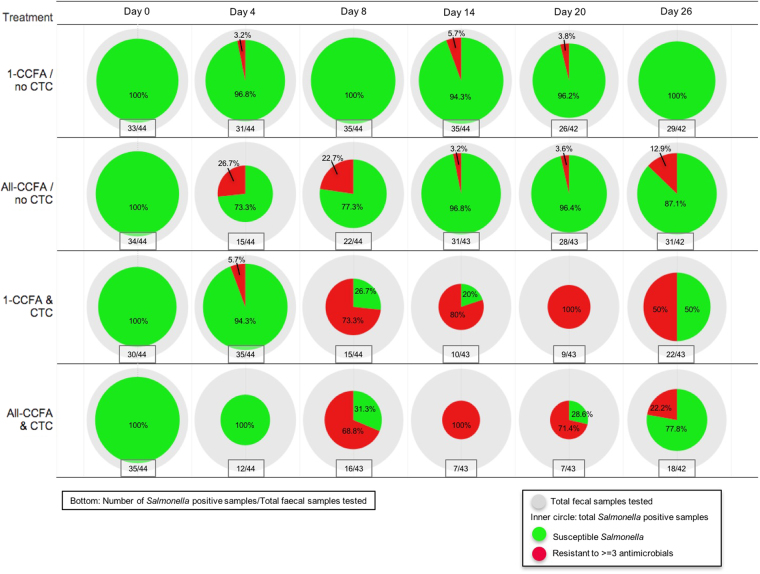
Figure 2.
Total number of isolates and proportion of MDR isolates per day and treatment. The outer circle (grey) reflects the number of faecal samples tested per pen each sampling day (n = 42 to 44). The size of the inner circle corresponds to the number of Salmonella isolates obtained each sampling day. The green piece of the inner circle represents pansusceptible Salmonella and the red piece represents resistance to 3 or more classes of antimicrobials (MDR). Total number of the Salmonella positive samples and total faecal samples tested are shown below each pie in the text box. Percentages of pansusceptible and MDR isolates are shown inside the circle.

